

Authors: Nidhila Masha, Jeff J. MacInnes, and Elizabeth N. Johnson
Institution Information: Duke Institute for Brain Sciences, Duke University, 308 Research Dr., Durham, NC 27710
ABSTRACT
Autism spectrum disorder (ASD) is a developmental condition that presents with a tendency to experience sensory overload as well as deficits in social cognition and communication which may be associated with differences in facial processing strategies. Previous studies have shown that, when viewing a facial image, participants with ASD spend less time on the eyes and lips—which contain more emotional and social information than other areas of the face. This study investigates whether individuals with an autism-related phenotype avoid the eyes of facial images in order to reduce their risk of experiencing sensory overload. Neurotypical participants, either possessing or lacking an autism-related phenotype, viewed images drawn from two stimuli sets: a control set of color images and an experimental set consisting of grayscale and reduced contrast images. Humans have been shown to use color as a source of social information (e.g. relative health, sex, emotion, etc.); the grayscale images in the experimental set thus contained less socially relevant information than the color images in the control set. The color images also contained more brightness and contrast—both of which are potential triggers of sensory overload—than the reduced contrast images. The results revealed that participants with an autism-related phenotype spent more time focusing on the eyes of grayscale images than on the eye region in color images. However, this effect was not observed when reduced contrast images were compared to color images. These results, when extrapolated to a population with a true autism phenotype, suggest that individuals with autism may process grayscale images differently than color images.
INTRODUCTION
Humans spend their lives in environments that contain more detail than they have the capacity to process. Thus, the ability to focus attention on only the most salient stimuli in an environment prevents humans from living in a state of perpetual sensory overload.
Developmental studies have shown that infants direct their gaze to faces more than to any other stimuli (Johnson et al., 1991), implying that humans have evolved to consider faces as particularly valuable and salient. Faces provide a rich source of social information, and this ability to perceive facial cues aids communication. Even brief exposure to a static facial image allows humans to make trait inferences about the face in question while gauging characteristics such as warmth and threat (Barry, 1990). Accordingly, being able to quickly identify potential threats provides an important evolutionary survival advantage.
When viewing faces, most individuals tend to spend the most time on the eyes, nose, and mouth. As a result, these three features have been dubbed the core areas of the face (Hernandez et al., 2009). Of these three core areas, neurotypical people tend to spend the most amount of time on the eyes (Ristic et al., 2005). Since the eyes contain more social information than any other area of the face (Ristic et al., 2005), a preference for the eyes provides a distinct evolutionary advantage and is a crucial facilitator of social interaction. This preference is diminished in individuals with autism spectrum disorder (ASD) (Jones et al., 2008), a developmental condition that presents with deficits in social cognition and communication. Eye-tracking studies exploring how participants with and without autism view faces suggest that those with ASD tend to spend more time on the mouth than the eyes (Klin et al., 2002) and tend to spend less time on the core facial features overall (Pelphrey et al., 2002).
Researchers have advanced a variety of theories as to why individuals with autism tend to spend less time on the eyes and mouths of facial images—and why, between these two features, individuals with autism tend to spend more time on mouths than on eyes. A study by Jones et al. (2008) attributes this tendency to a desire for audiovisual synchronization. Other studies have found that making eye contact triggers a fear response in participants with autism, suggesting that the negative emotions associated with looking at eyes could condition individuals with ASD into spending less time doing so (Dalton et al., 2005; Ashwin et al., 2007). The purpose of this current study is to advance and investigate a third theory that the avoidance of eye contact characteristic of autism could be traced back to a specific symptom of the disorder—the tendency to experience sensory overload (Marco et al., 2012).
Humans have evolved to spend extra time focusing on the eyes of facial images because the eyes contain large amounts of socially relevant information (Baron-Cohen, 1995). Gaze direction alone provides cues as to where a person is directing their attention and as to how much the object of their attention interests them (Ristic et al., 2005). The eyes can also provide clues to emotional state (Baron-Cohen, 1995). Individuals with autism may avoid the eyes because they provide such a variety of social cues. Avoiding such an information-rich area of the face could reduce the amount of sensory information needing to be processed, leading to a decreased risk of experiencing sensory overload. A study by Spezio et al. (2007) found that participants with autism were more likely to direct their gaze away from the eye region of a facial image when the eyes were partially obscured by an opaque grey mask (in other words, when the eyes contained a decreased amount of information by virtue of being partially covered) as opposed to when the mask did not obscure the eyes at all.
Thus, if individuals with autism view images differently in order to guard against sensory overload, suggesting that they avoid the eyes of images in order to decrease the amount of information they need to process, then they should be more comfortable viewing the eyes of images that contain lower amounts of socially relevant information (such as color). Humans have been shown to use color as a source of social information; tinting neutral facial images with certain hues can make these images appear to express certain emotions or characteristics (Valdez and Mehrabian, 1994). However, grayscale images do not provide such cues. As a result, grayscale images can be said to contain less socially relevant information than their color counterparts, potentially making them less likely to trigger sensory overload. Reduced contrast images can similarly be said to contain less socially relevant information than full-contrast images. Lowering the contrast of an image may also reduce its risk of triggering sensory overload, since this process reduces glare, and dulls color contrast. Images with glare or sharp contrast are more likely to trigger sensory overload than images without these features (Scott, 2009).
This study investigated the facial processing strategies of two groups of neurotypical participants — one group with an autism-related phenotype, and one group without. All participants were asked to view a series of color, grayscale, and reduced contrast facial images. Afterwards, the amount of time each participant spent fixated on the eyes, mouth, and nose of these images was measured. We hypothesized that participants with the autism-related phenotype would spend more time on the eyes of the grayscale and reduced contrast images which were less likely to trigger sensory overload, and found that participants did spend more time on the eyes of grayscale images than they did on color images. This result lends support to the theory that individuals with autism view images differently perhaps in order to guard against sensory overload.
MATERIALS AND METHODS
Participants
25 adult participants aged from 18—28 years (mean age: 20.8, SD: 2.64 years) were recruited through DukeList, an online advertising site to which all current Duke University employees and students have access, for a larger eye-tracking study. All participants consented to perform a research study following procedures approved by Duke University’s Institutional Review Board.
All participants had normal or corrected to normal vision, none had been diagnosed with autism, and most were students enrolled at Duke University. Five participants were eliminated from the data set due to equipment malfunctions during testing. One participant was excluded due to experimenter error as their ID number was not recorded on their copy of the Broad Autism Phenotype Questionnaire and their scores on this task were lost.
Broad Autism Phenotype Questionnaire
None of the participants had been diagnosed with autism; however, the disorder exists on a spectrum and individuals can present with sub-clinical levels of the traits associated with the condition. These traits compose the Broad Autism Phenotype. The Broad Autism Phenotype Questionnaire (BAPQ; Hurley et al., 2007) is a task designed to measure the Broad Autism Phenotype in neurotypical adults.
The BAPQ measures adherence to the autism phenotype on three different subscales: rigidity, aloofness, and pragmatic language. The questionnaire is composed of 36 questions divided up evenly between the three subscales. Scores on each subscale are calculated using the results of the 12 questions which pertain to it. Each question asks the participant to rate (on a six-point Likert scale) how well a particular characteristic applies to them. A participant’s scores on each of the three subscales are then averaged to calculate that participant’s total BAPQ score. Thus, the highest possible score on the BAPQ is six, and the lowest possible score is one. If a participant’s total BAPQ score fell above a (3.15), that participant was said to present with an autism-related phenotype. The official cutoff for the BAPQ test is 3.15, as set by the design of the questionnaire (Hurley et al., 2007).
After completing the eye-tracking portion of the study, participants were asked to take the BAPQ. The questions composing the BAPQ were administered through a multiple choice Qualtrics survey, which participants completed on the computer used for the eye-tracking task.
Stimuli
Participants were shown a total of 110 stimuli drawn from diverse, emotionally neutral, image categories. For the purposes of this study, a subset of 32 images was analyzed, all of which came from Nina Strohminger’s MR2 database (Strohminger et al., 2016). All 32 images were of forward-facing adults photographed against a plain white background and under controlled, even studio lighting. Images were selected to have a 1:1 ratio of male to female faces, and a near even racial distribution (11 African American, 10 Caucasian, and 11 Asian face images).
The 12 images in the control set represented the “more facial information” condition and were in full color. The 20 images in the experimental set represented the “less facial information” condition. Ten of these 20 images were in grayscale (black and white). The remaining 10 images were created by overlaying an opaque grey layer over a set of color images and then reducing the transparency of this top layer to 75%. The underlying image was visible but tinted grey with diminished overall contrast and brightness.
Other Testing
Since this experiment was conducted as part of a larger eye-tracking study, not all of the tasks participants completed were relevant to this analysis. In addition to the tasks outlined below, participants also completed the Kaufmann Intelligence Test, a Social intelligence Test, a personality questionnaire, and a demographics questionnaire.
Eye-tracking and Task
A Tobii T60XL eye-tracker with a high-resolution 24-inch monitor and a sampling rate of 60Hz was used to collect the eye-tracking data. Participants were asked to seat themselves at a comfortable distance from the monitor, with their heads unrestrained.
Before presenting the stimuli, the eye-tracker was calibrated using a nine-point procedure. A series of nine rotating shapes (e.g. triangles or squares) appeared on different areas of the screen. Participants were asked to direct their gaze to the center of each shape as it appeared and maintain their gaze until the shape grew too small to see.
At the start of the experiment, participants were instructed to view the images as they would normally view objects on a screen. Each of the 110 stimuli was presented for five seconds, and the order of presentation was randomized across stimulus categories. Before each image was presented, a fixation cross would appear on the screen in an unpredictable location (locations constrained to an area centered on the screen and 66% of the total screen extent). After each fixation cross appeared, participants pressed a key in order to advance to the next stimulus. After every 30 images, participants were given the option to take a short break.
Processing Eye-Tracking Data
The Tobi eye tracking system measured the location of each participant’s gaze at 60Hz. A Dispersion-Threshold Identification system (Salvucci and Goldberg, 2000) was used to define a fixation as a period of 100 ms or more, during which a participant’s gaze did not deviate more than 1.5° of visual angle from a given point. The analysis pipeline (MacInnes, 2016) was designed to exclude the first fixation of each viewing period if that fixation corresponded with the location of the fixation cross. The pipeline also compiled the number and duration of fixations occurring on pre-defined areas of interest, reporting the sum amount of time a participant spent on each of these areas for a specific image.
Areas of interest (AOIs) were defined on each stimulus by having four independent researchers manually trace separate regions for the left eye, right eye, mouth, and nose. The four tracings for each region were aggregated into a master AOI for that region on a given stimulus. If a fixation occurred on any other region of the image, it was labeled as a fixation outside an area of interest. The pipeline also reported the amount of time participants spent viewing the image without fixating on any specific AOI.
The dependent variable of this experiment was time spent on the eyes, which was calculated by adding the combined amount of time a participant spent on the left and right eyes. The independent variables of this experiment were whether the participants scored above or below the cutoff on the BAPQ and image type (color, grayscale, or reduced contrast).
Analysis
BAPQ Analysis
Though none of the participants in this experiment had been diagnosed with autism, those who scored above the cutoff on the Broad Autism Phenotype Questionnaire (BAPQ) were labeled as having an autism-related phenotype. The BAPQ measures levels of rigidity, aloofness, and use of pragmatic language; these are traits that have been linked to autism but do not comprise the full range of symptoms associated with the condition. As a result, there are certain traits associated with autism that the BAPQ fails to measure. For example, though individuals with autism utilize different facial processing strategies than neurotypical individuals, (Pelphrey et al., 2002; Jones et al., 2008; Klin et al., 2002; Neumann et al., 2006; Hutchins and Brien, 2016) the BAPQ fails to measure whether a participant’s facial processing patterns conform to the autistic phenotype. Despite this, the BAPQ was used in the current study to determine whether a participant’s facial processing strategies could be taken as representative of the facial processing strategies of a participant with autism. We reasoned that participants conforming to the autism phenotype on the three core traits of the BAPQ, defined as the BAPQ positive (BAPQ+) group, would likely exhibit facial processing patterns that conformed to the autistic phenotype. Participants whose total BAPQ score fell below the cutoff of 3.15 were labeled the BAPQ negative (BAPQ-) group.
In order to test this hypothesis, participants’ BAPQ scores were compared against the time they spent on eyes of color images. Previous studies suggested that participants with autism tend to spend less time on the eyes of color images than participants without autism (Jones et al., 2008; Klin et al., 2002; Neumann et al., 2006). If BAPQ+ participants spent less time on the eyes of color images than BAPQ- participants, then this would suggest that the BAPQ is an accurate measure of the autism phenotype with regards to facial processing.
Eye-tracking Data Analyses
RESULTS
BAPQ Score Distribution
An independent t-test was used to compare the time spent on the eyes of images in the control set (color images) between BAPQ- participants and BAPQ+ participants. The threshold used for statistical significance was p ≤ 0.05. A two-way ANOVA was used to investigate the effect of group (BAPQ+ vs. BAPQ-) and image category (grayscale vs. color vs. reduced contrast) on eye-dwell times.
Due to the small sample size of the BAPQ+ group, a follow-up analysis was run in order to measure the effect of image category on participants in the BAPQ+ group alone. A repeated measures ANOVA was used to test for differences in the time spent on the eyes across each of the image sets (color, grayscale, reduced contrast). The threshold used for statistical significance was p ≤ 0.05. A second follow up analysis was run in order to measure the effect of image category on participants in the BAPQ- group alone. A repeated measures ANOVA was used to test for differences in the time spent on the eyes across each of the image sets (color, grayscale, reduced contrast). The threshold used for statistical significance was p ≤ 0.05.
RESULTS
BAPQ Score Distribution

Figure 1. Distribution of BAPQ scores across subjects. This figure illustrates that 5 subjects scored above the cutoff and were labeled BAPQ+ (red). 14 subjects scored below the cutoff and were labeled BAPQ- (blue).
Out of 19 participants, five had a total BAPQ score above 3.15 and were subsequently labeled “BAPQ+,” while the remaining 14 participants had a total score below the cutoff and were labeled “BAPQ-” (Figure 1). The total average BAPQ score was 2.89 with a standard deviation of 0.4927. The total average BAPQ score within the BAPQ+ group was 3.54 with a standard deviation of 0.3290, and the total average BAPQ score within the BAPQ- group was 2.66 with a standard deviation of 0.2874.
Time Spent on the Eyes of Color Images was Greater in BAPQ+ than BAPQ- Participants
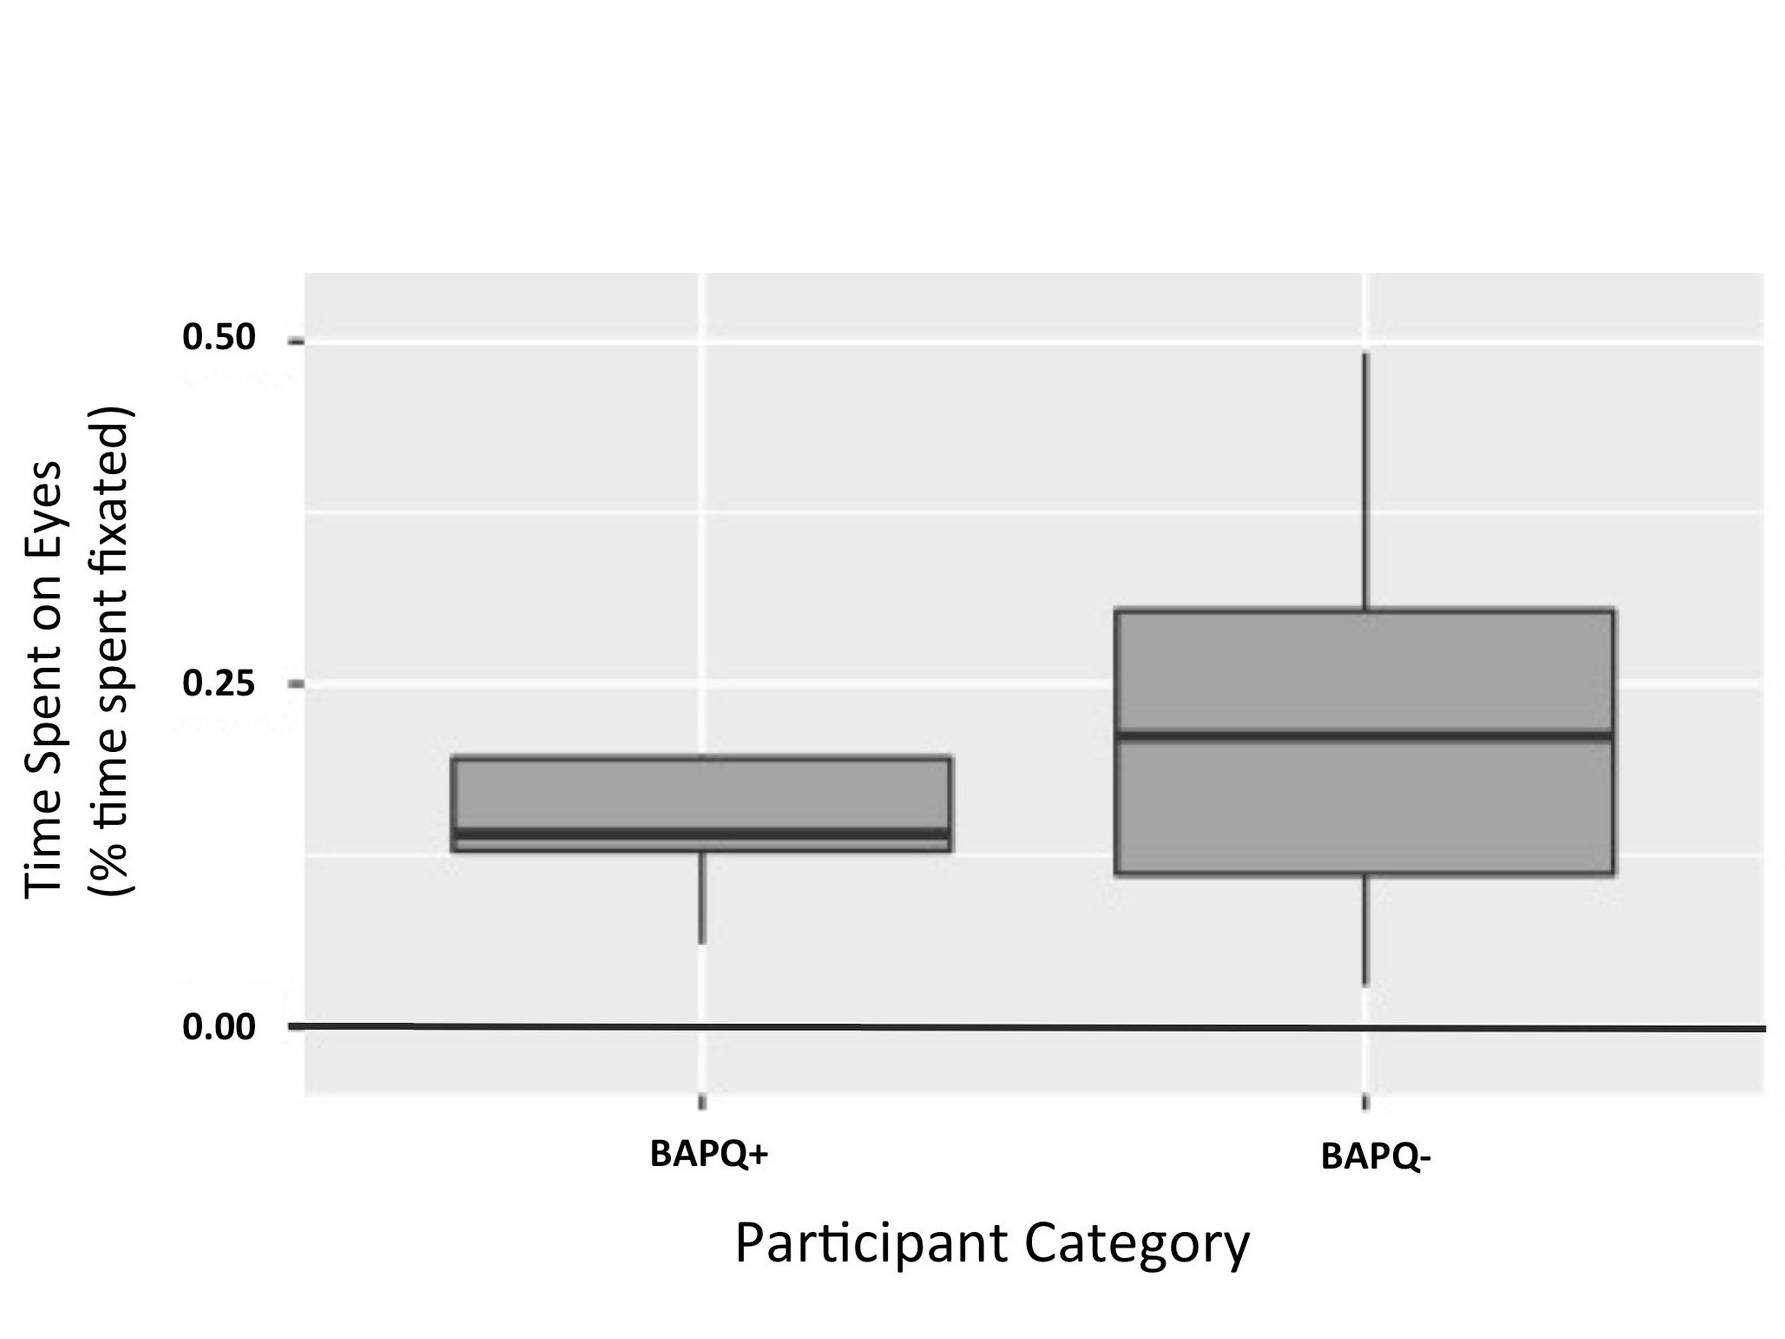
Figure 2. Time spent on eyes by participant category. This figure illustrates that effect of BAPQ score on time spent on the eyes of color images was not significant. (p = 0.119)
It was hypothesized that BAPQ+ participants would spend less time on the eyes of color images, compared to BAPQ- participants. An independent t-test was used to test this prediction. It was observed that BAPQ+ participants spent less time on the eyes of color images than the BAPQ- participants, however this difference failed to reach statistical significance in this sample: t(16.475) = -1.6441, p = 0.1191, with means (SD) of 0.14 (0.06) for the group with the autism related phenotype and 0.22 (0.14) for the group without the autism related phenotype (Figure 2).
Time Spent on the Eyes of Grayscale and Reduced Contrast Images was not Significantly Different Between BAPQ+ and BAPQ- Participants
It was hypothesized that BAPQ+ participants would spend more time on the eyes of grayscale and reduced contrast images than they would on the eyes of control color images. A two-way ANOVA within group (BAPQ+, BAPQ-) as the between subjects variable and image category (grayscale, color, reduced contrast) as the within subjects variable was used in order to test this prediction.
There was a main effect of image category F(1, 2) = 3.6060, p = 0.03737 (Figure 3). Post hoc comparisons using pairwise comparison tests indicate that there is a significant difference in the eye dwell time for grayscale images (M = 0.22, SD = 0.034) and color images (M = 0.186, SD = 0.034); p = 0.0322. There was no significant difference in the eye dwell time for color images (M = 0.186, SD = 0.034) and reduced contrast images (M = 0.198, SD = 0.034); p = 0.6623. There was no significant difference in the eye dwell time for grayscale images (M = 0.22, SD = 0.034) and reduced contrast images (M = 0.198, SD = 0.034); p = 0.1957.
The BAPQ+ participants did not significantly differ from BAPQ- participants in the amount of time they spent on the eyes of images, F(1,2) = 0.7367, p = 0.40267 (Figure 3). While the two-way ANOVA showed no main effect of group, this result may have been due to the small sample size of the BAPQ+ group. Follow up analyses were run independently in each group.
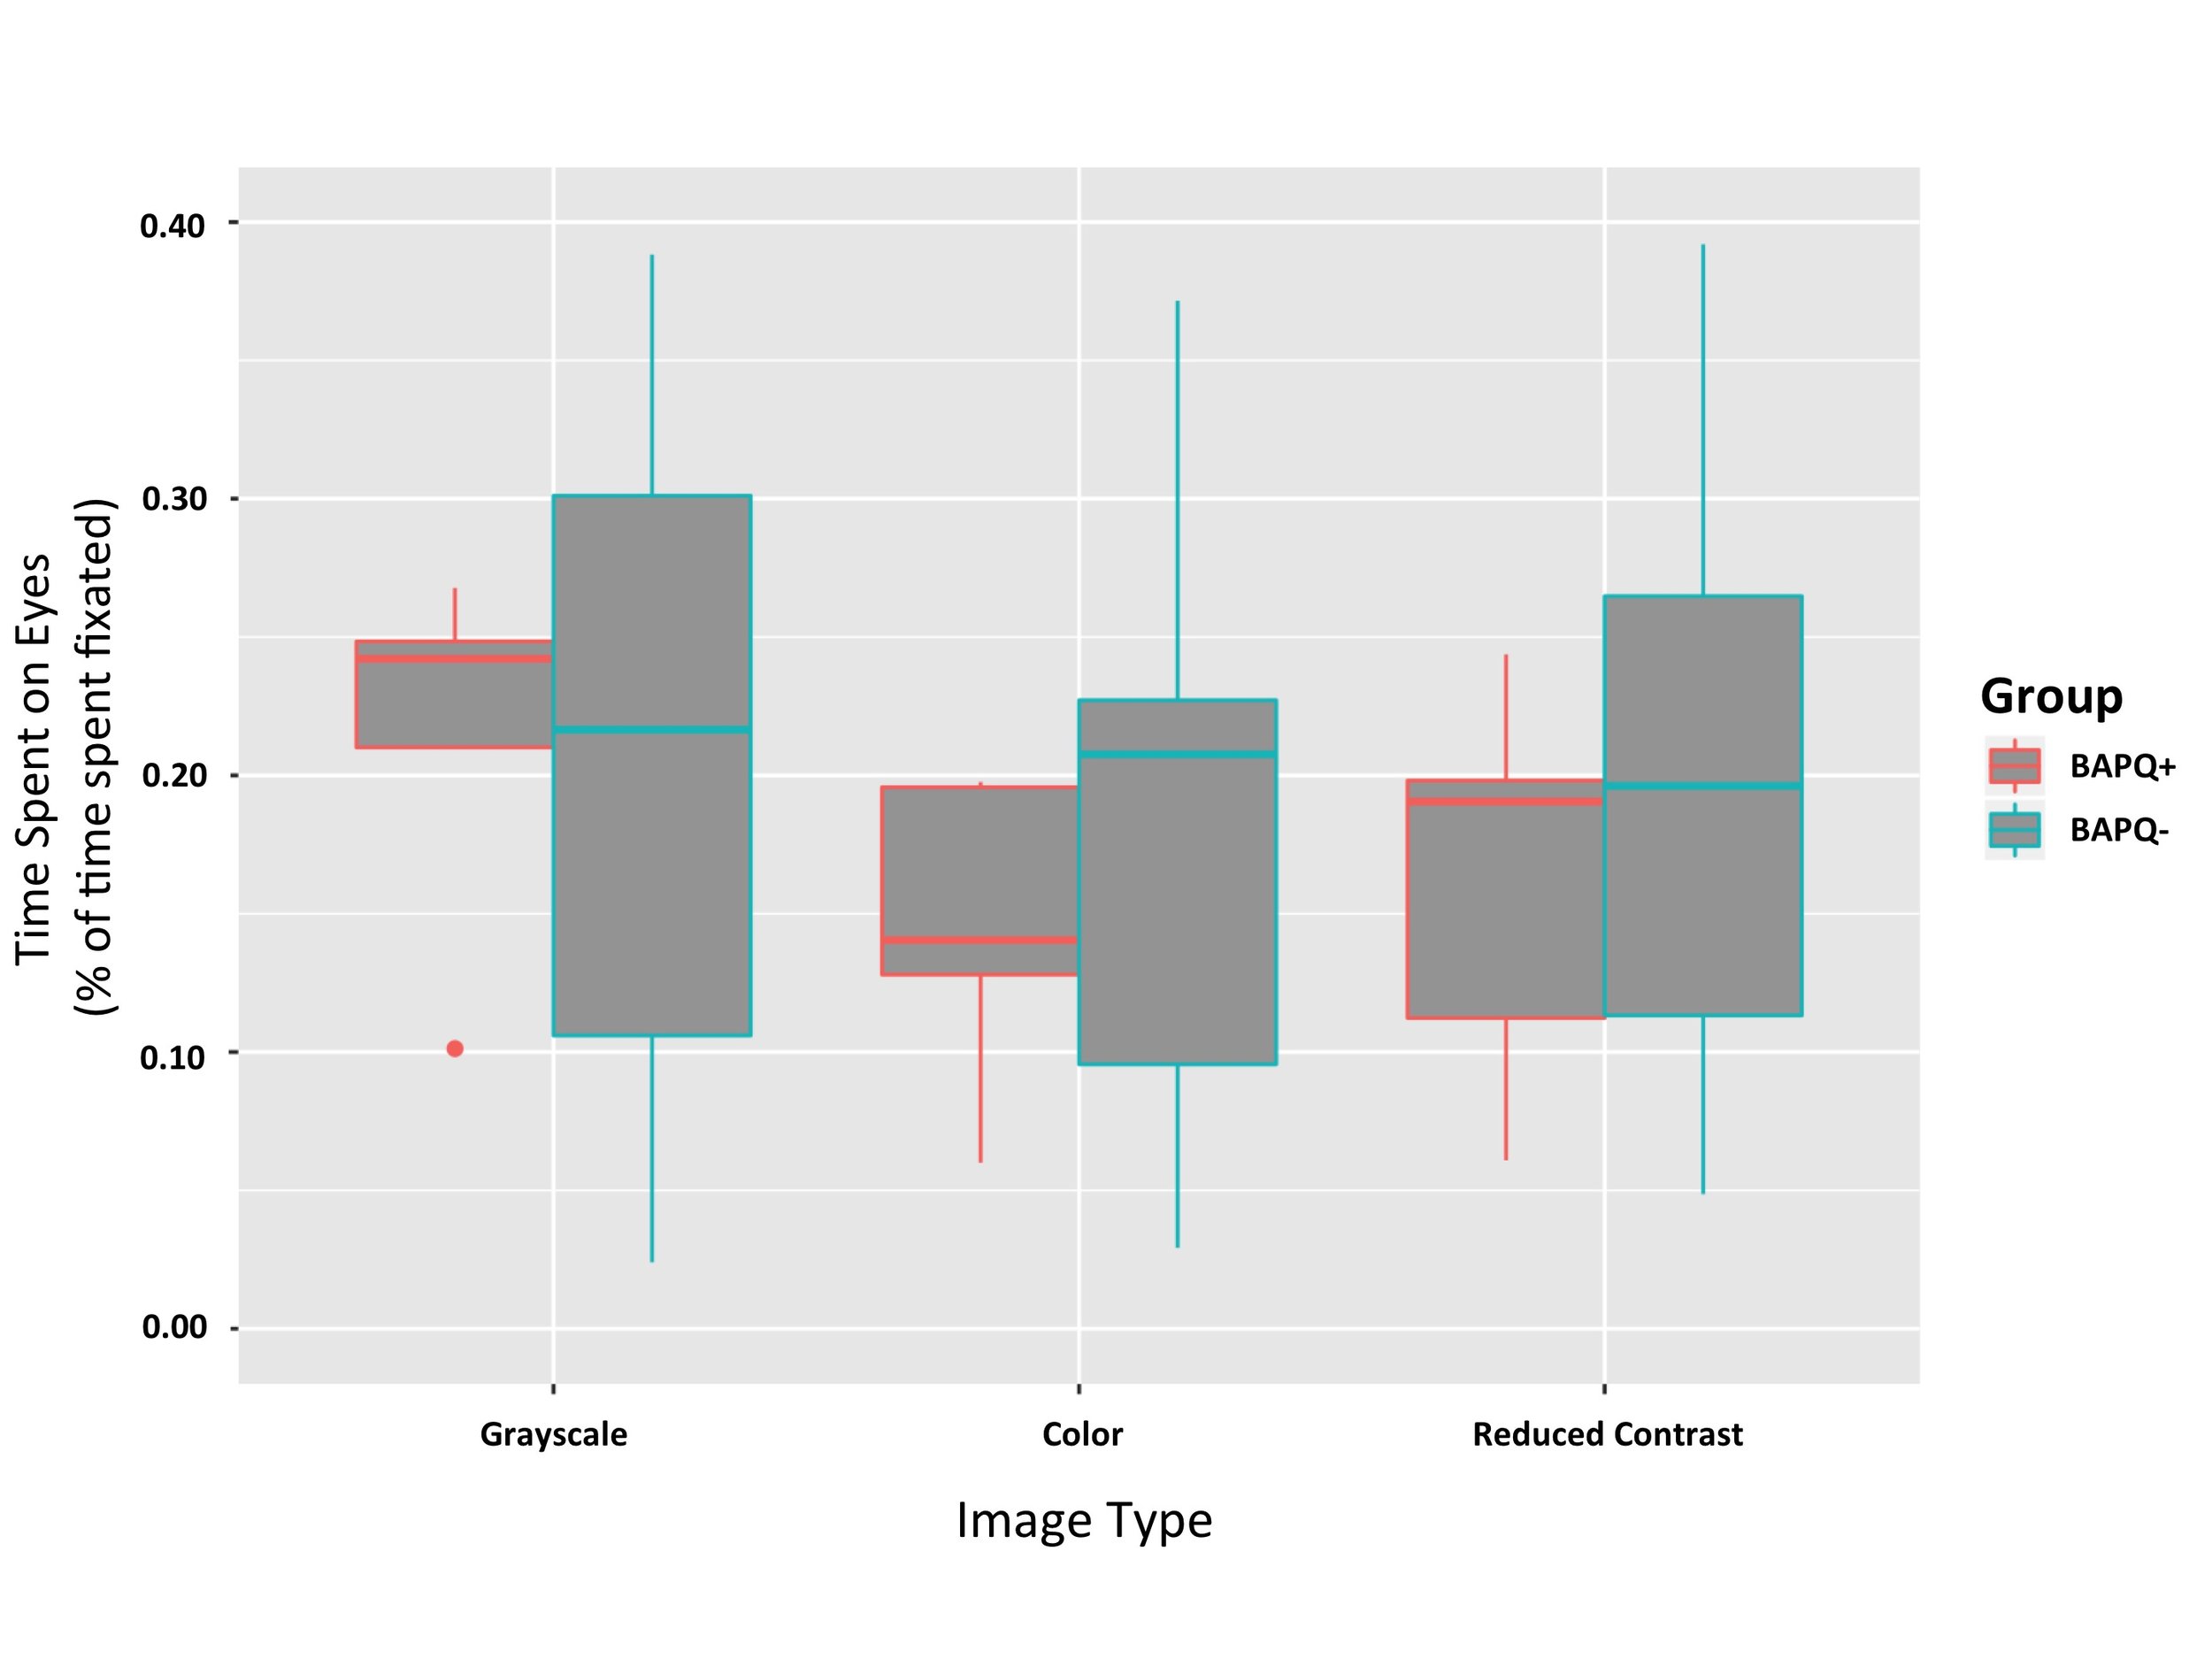
Figure 3. Time spent on eyes by group and image category. No main effect of group on time spent on the eyes (p = 0.403). Effect of image category on time spent on the eyes was significant (p = 0.037). Subjects spent more time on the eyes of grayscale images (Mean = 0.22, SD = 0.034) than they did on control images (Mean = 0.186, SD = 0.034).
Follow Up Analysis: Among BAPQ+ Participants, Time Spent on the Eyes of Grayscale Images was Greater Than for Reduced Contrast and Colored Images
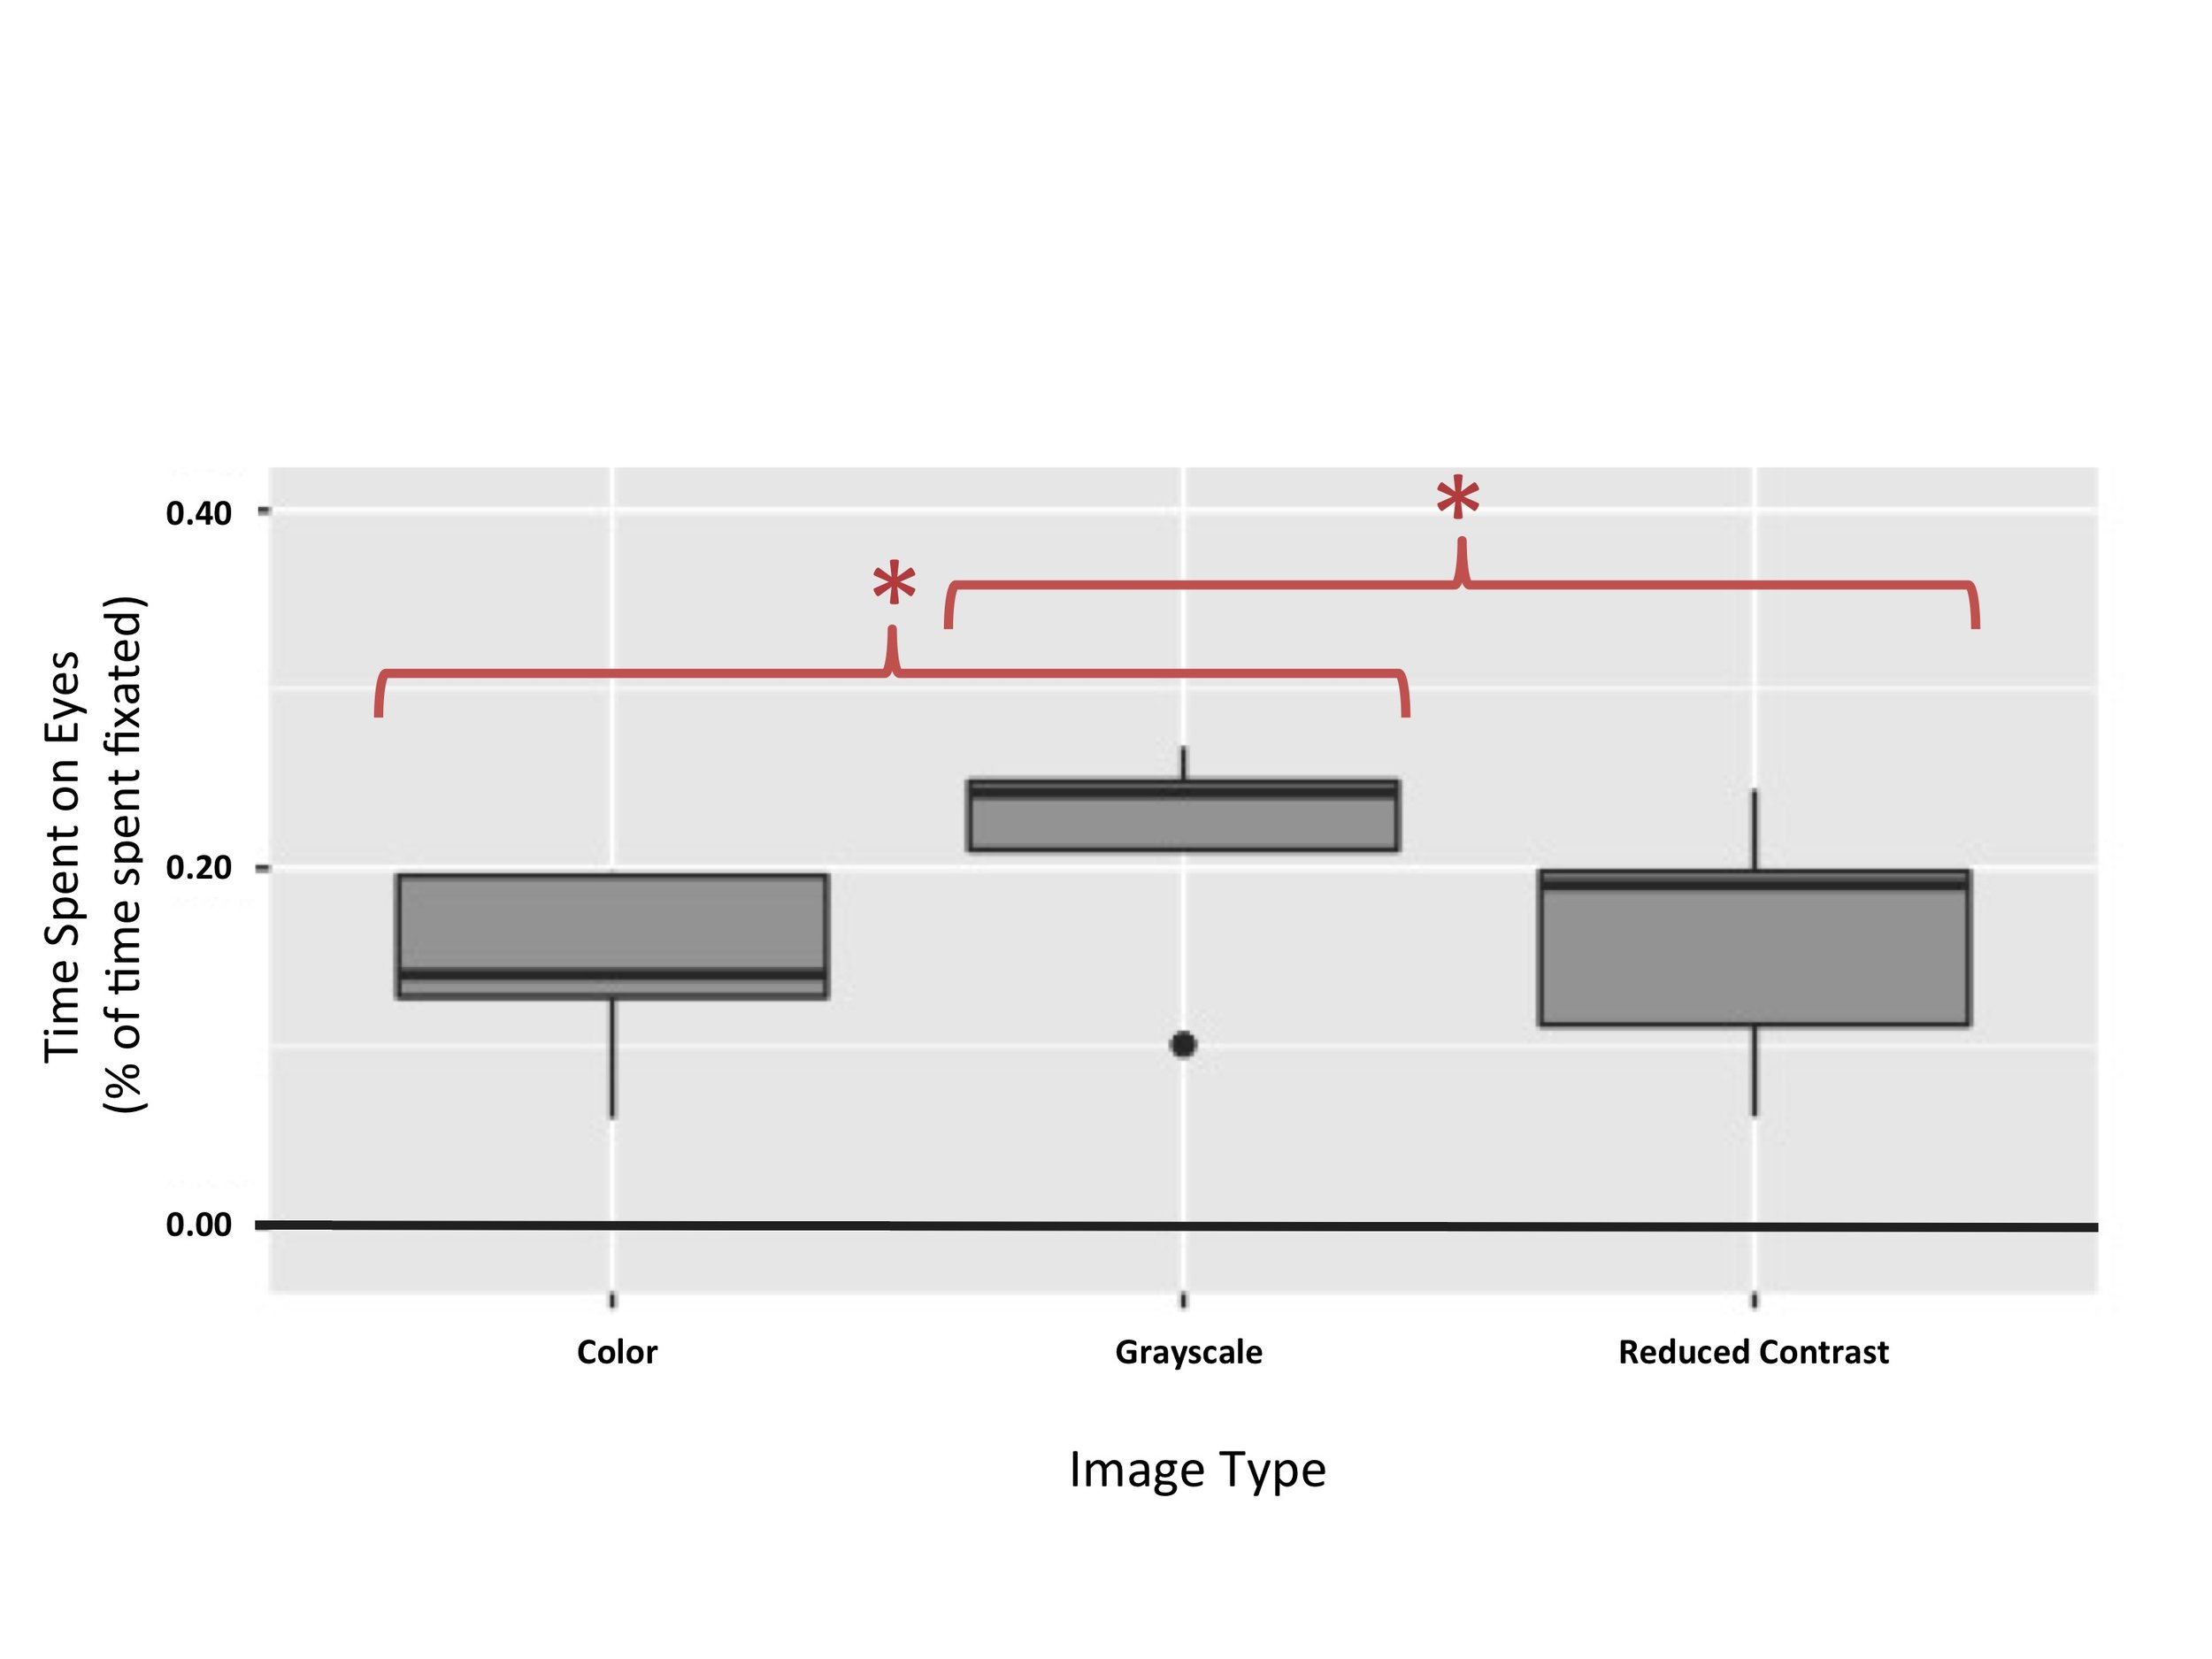
Figure 4. Time spent on eyes in BAPQ+ participants. This figure illustrates that effect of image category on time spent on eyes was significant for subjects with an autism phenotype (p = 0.00937). Subjects with an autism phenotype spent more time on the eyes of grayscale images (Mean = 0.21, SD = 0.07) than on the eyes of color images (Mean = 0.14, SD = 0.06) or images under a contrast filter (Mean = 0.16, SD = 0.07).
A repeated measures ANOVA was used in order to test the prediction that BAPQ+ participants would spend more time on the eyes of grayscale and reduced contrast images than they would on the eyes of control color images. There were significant differences in the amount of time BAPQ+ participants spent on the eyes of grayscale, color, and reduced contrast images, F(2,8) = 8.857, p = 0.00937 (Figure 4). Post hoc comparisons using paired t-tests indicate that there is a significant difference in the eye dwell time for grayscale images (M = 0.21, SD = 0.07) and color images (M = 0.14, SD = 0.06); t(4) = 4.3106, p = 0.01254. These results also indicate that there is a significant difference in the eye dwell time for grayscale images (M = 0.21, SD = 0.07) and reduced contrast images (M = 0.16, SD = 0.07); t(4)=4.2325, p = 0.01334. There was no significant difference in the eye dwell time for color images (M = 0.14, SD = 0.06) and reduced contrast images (M = 0.16, SD = 0.07); t(4) = -0.76779, p = 0.4854.
Follow Up Analysis: No Significant Difference in Time Spent on the Eyes of Grayscale, Reduced Contrast, and Color Images Among BAPQ- Participants

Figure 5. Time spent on eyes in BAPQ- participants. This figure illustrates that effect of image category on time spent on eyes was not significant for subjects without an autism phenotype (p = 0.00937).
A repeated measures ANOVA was used in order to test the prediction that the amount of information present in an image would have no effect on eye-dwell time in BAPQ- participants. There was no significant difference in the amount of time BAPQ- participants spent on the eyes of grayscale, color, and reduced contrast images: F(2,26) = 0.06114, p = 0.377 (Figure 5).
DISCUSSION
We tested the overall time that participants spent on the eyes of three categories of facial images: grayscale, reduced contrast, and color images. The BAPQ+ participants were found to spend significantly more time on the eyes of grayscale images than they did on color images. However, there was no significant difference between the time they spent on the eyes of reduced contrast versus color images.
Before testing the effect of image category on eye-dwell time, an analysis was run to see whether or not the BAPQ+ participants spent more time on the eyes of color images than the BAPQ- participants did. The purpose of this analysis was to test whether or not our findings about individuals with an autism-related phenotype could potentially be extrapolated to individuals with an autistic phenotype. Previous studies have shown that individuals with autism tend to spend significantly less time on the eyes of color images than neurotypical individuals. However, while BAPQ+ participants did spend less time on the eyes of color images than BAPQ- participants, the difference was not statistically significant. Nevertheless, this lack of significance could be a consequence of the small sample size of the cohort as only five participants were labeled as BAPQ+ participants. Additionally, though the p-value of the test was above the cutoff required for statistical significance, it was approaching trend level (p= .119). Future studies should revisit this hypothesis with a larger subject pool as well as an adult clinically-diagnosed ASD participant pool.
Follow up analyses were conducted to investigate the effects of image category on the BAPQ+ group and the BAPQ- group separately. These analyses showed that BAPQ+ participants spent significantly more time on the eyes of grayscale images than they did on the eyes of color images, while BAPQ- participants did not spend significantly more time on the eyes of grayscale images. Such results suggest that the increase in eye-dwell time amongst grayscale images may be attributed to the fact that grayscale images contain reduced amounts of information, since full-contrast color images are a richer source of social information than grayscale images are. Seeing certain hues in a facial image can make participants more likely to associate the face with a specific emotion. For example, a red-tinted face is more likely to be perceived as angry (Valdez and Mehrabian, 1994). This association indicates that humans use color as a source of social information, making grayscale images a poorer source of social information than color images (Valdez and Mehrabian, 1994). Color images are thus potentially more likely to trigger sensory overload than their grayscale counterparts, as grayscale images provide viewers with less socially relevant information to process and may also be less realistic and therefore perceived as less threatening. Reducing the contrast of a color image may similarly diminish its risk of triggering sensory overload—by virtue of reducing potential risk factors such as glare and color range.
Neither BAPQ+ or BAPQ- participants spent significantly more time on the eyes of reduced contrast images than they did on the eyes of color images. These results may suggest that either reducing glare and color range does not decrease an image’s potential to trigger sensory overload, or individuals with an autism-related phenotype do not avoid the eyes of images in order to decrease risk of experiencing sensory overload. However, it is likely that these results can be traced back to the fact that the 75% contrast filter used for the purposes of this experiment may not have been sufficient to make a perceptible difference in the amount of glare or saturation that the reduced contrast images contained. A more opaque contrast filter which diminishes brightness and color range to a greater degree may have succeeded in eliciting an increase in eye-dwell time among participants in the BAPQ+ cohort.
The results of this experiment suggest that BAPQ+ participants process grayscale images differently than BAPQ- participants. Unlike BAPQ+ participants, BAPQ- participants did not show an increase in eye-dwell time for grayscale images. Yet, some limitations to this analysis exist, due to the fact that all participants tested were undiagnosed with autism and, to the best of our knowledge, neurotypical. The facial viewing patterns of neurotypical participants with a BAPQ score above the cutoff may not be comparable to the facial viewing patterns of participants diagnosed with ASD. Nonetheless, these findings suggest that using a grayscale filter may affect the gaze patterns of certain population groups more than others.
Since the facial processing strategies of neurotypical BAPQ+ individuals may not fully reflect the facial viewing patterns of individuals diagnosed with ASD, further studies can strengthen this research by testing a population of individuals diagnosed with ASD in comparison with a control group of neurotypical individuals. However, future studies should avoid using contrast-filters as a way to diminish an image’s risk of triggering sensory overload. It is difficult to determine, without prior experimentation, the level to which an image’s contrast needs to be reduced before the decrease in brightness and color range can have a perceptible effect on the image’s ability to trigger sensory overload.
Several studies have used eye tracking to investigate the ways in which individuals with autism process facial images differently from neurotypical individuals. Many of these studies use grayscale images as a substitute for color images since grayscale images are easier to control and manipulate (Johnson et al., 1991; Pelphrey et al., 2002; Dalton et al., 2005). However, grayscale images are also less naturalistic than color images and have been allowed to stand substitute because of the assumption that a lack of image color will not affect the strategies individuals use to process these visual stimuli. The results of the experiments outlined in this study contradict this assumption and suggest that presenting images in grayscale does affect gaze patterns in individuals with an autism-related phenotype. This finding suggests that future eye-tracking studies on autistic populations should be wary of using grayscale images as a substitute for color images.
ACKNOWLEDGMENTS
NM is extremely grateful for her mentors, Elizabeth Johnson and Jeff MacInnes, for their guidance and support. NM would also like to thank Jeff MacInnes, Anuhita Basavaraju, Eduardo Salgado, Chris Yoo, and Peter Cangialosi for implementing the experimental task and analysis pipeline, as well as Lily Chaw, Elaine Cox, and Sophie Katz for their contributions to the data collection.
REFERENCES
Ashwin, C., Baron-Cohen, S., Wheelwright, S., O’Riordan, M., Bullmore, E.T. (2007). Differential activation of the amygdala and the ‘social brain’ during fearful face processing in asperger syndrome. Neuropsychologia, 45(1), 2–14. doi:10.1016/j.neuropsychologia.2006.04.014.
Baron-Cohen S. (1995) Mindblindness: An Essay on Autism and Theory of Mind. [E-reader version]. Retrieved from https://web-b-ebscohost-com.proxy.lib.duke.edu/ehost/detail/detail?vid=0&sid=32d1731e-523d-4aa5-b5e2-c2d829ad839d%40sessionmgr101&bdata=JnNpdGU9ZWhvc3QtbGl2ZQ%3d%3d#AN=48513&db=nlebk.
Barry, D. S. (1990). Taking People at Face Value: Evidence for the Kernel of Truth Hypothesis. Social Cognition, 8(4), 343-361. doi:10.1521/soco.1990.8.4.343
Dalton, K.M., Nacewicz, B.M., Johnstone, T., Schaefer, H.S., Gernsbacher, M.A., Goldsmith, H.H., Alexander, A.L., Davidson, R.J., (2005). Gaze fixation and the neural circuitry of face processing in autism. Nature Neuroscience, 8(4), 519–526. doi:10.1038/nn1421.
Salvucci, D.D., Goldberg J.H. (2000). Identifying fixations and saccades in eye-tracking protocols. In Proceedings of the 2000 symposium on Eye tracking research & applications. New York, NY, 71-78. doi:10.1145/355017.355028.
Hernandez, N., Metzger, A., Magne, R., Bonnet-Brilhault, F., Roux, S., Barthelemy, C., Martineau, J. (2009). Exploration of core features of a human face by healthy and autistic adults analyzed by visual scanning. Neuropsychologia, 47(4), 1004-1012. doi:10.1016/j.neuropsychologia.2008.10.023.
Hurley, R., Losh, M., Parlier, M., Reznick, J.S., Piven, J. (2007). The Broad Autism Phenotype Questionnaire. Journal of Autism and Developmental Disorders, 37(9), 1679-1690. doi: 10.1007/s10803-006-0299-3.
Hutchins, T., Brien, A. (2016) Conversational topic moderates social attention in autism spectrum disorder: Talking about emotions is like driving in a snowstorm. Research in Autism Spectrum Disorders, 26, 99-110. doi:10.1016/j.rasd.2016.03.006.
Johnson, M., Dziurawiec, S., Ellis, H., Morton, J. (1991). Newborns’ preferential tracking of face-like stimuli and its subsequent decline. Cognition, 40(1-2), 1-19. doi:10.1016/0010-0277(91)90045-6.
Jones, W., Carr, K., Klin, A. (2008). Absence of preferential looking to the eyes of approaching adults predicts level of social disability in 2-year-old toddlers with autism spectrum disorder. Archives of General Psychiatry, 65(8), 946–954. doi:10.1001/archpsyc.65.8.946.
Klin, A., Jones, W., Schultz, R., Volkmar, F., Cohen, D. (2002) Visual Fixation Patterns During Viewing of Naturalistic Social Situations as Predictors of Social Competence in Individuals with Autism. Archives of General Psychiatry, 59(9), 809-816. doi:10.1001/archpsyc.59.9.809.
MacInnes, J. (2016). Python (Version 2.7) [Computer software]. Retrieved from https://github.com/jeffmacinnes/AVB_tobii_pipeline/blob/master/filteringSteps.ipynb
Marco, E., Hinkley, L., Hill, S., Nagarajan, S. (2012). Sensory Processing in Autism: A Review of Neurophysiologic Findings. Pediatric Research, 69(5 Pt. 2), 48R-54R. doi:10.1203/PDR.0b013e3182130c54
Neumann, D., Spezio, M., Piven, J., Adolphs, R. (2006). Looking you in the mouth: abnormal gaze in autism resulting from impaired top-down modulation of visual attention. Social Cognitive and Affective Neuroscience, 1(3), 194-202. doi:10.1093/scan/nsl030.
Pelphrey, K., Sasson, N., Reznick, J., Paul, G., Goldman, D., Piven, J. (2002). Visual scanning of faces in autism. Journal of Autism and Developmental Disorders, 32(4), 249-261. doi:10.1023/A:1016374617369
Ristic, J., Mottron, L., Friesen, C., Iarocci, G., Burack, J., Kingstone, A.(2005). Eyes are special but not for everyone: The case of autism. Cognitive Brain Research, 24(3), 715-718. doi:10.1016/j.cogbrainres.2005.02.007.
Scott, I. (2009). Designing learning spaces for children on the autism spectrum. Good Autism Practice (GAP). 10. 36-51. Retrieved from https://www.researchgate.net/publication/233696730_Designing_learning_spaces_for_children_on_the_autism_spectrum
Spezio, M., Adolphs, R., Hurley, R., Piven, J. (2007). Analysis of face gaze in autism using “Bubbles”. Neuropsychologia, 45(1), 144-151. doi:10.1016/j.neuropsychologia.2006.04.027.
Strohminger, N., Gray, K., Chituc, V., Heffner, J., Schein, C., Heagins, T.B. (2016). The MR2: A multi-racial mega-resolution database of facial stimuli. Behavior Research Methods, 48:1197-1204. doi:10.3758/s13428-015-0641-9
Valdez, P. Mehrabian, A. (1994). Effects of Color on Emotions, 123(4), 394-409. doi:10.1037/0096-3445.123.4.394.