

Amelia Dolgin and Jason Adolf
Institution Information: Department of Marine Sciences at the University of Hawai’i at Hilo
ABSTRACT
Scanning electron microscopy (SEM) has many applications in the marine sciences field, one of which is proper discrimination between toxic and non-toxic species of phytoplankton. Some key morphological differences between species are often too small to identify without the aid of SEM, and the quality of the images relies heavily on the preservation technique used. Chemical fixatives are utilized to preserve cells with minimal alterations in morphology and to increase the structural integrity of the cells prior to dehydration. These methods, although successful, involve the use of toxic chemicals such as formaldehyde and glutaraldehyde. The objective of this study was to experiment with different fixatives utilized and cited in older literature, and prepare an entirely new chemical fixative method using a natural cross-linking compound known as genipin. Four phytoplankton species were used to qualitatively compare various treatments in order to determine which fixation technique would result in the highest quality of cell preservation for SEM analysis. The results indicated that no singular treatment proved most successful for all of the species tested. However, this study shows for the first time that genipin is a successful alternative chemical fixative for processing phytoplankton for SEM analysis. The use of genipin as a replacement for traditional chemical fixatives serves to minimize risks imposed on researchers and create a safer environment for those who come into contact with these substances on a regular basis.
INTRODUCTION
The use of scanning electron microscopy (SEM) for identifying marine phytoplankton is an invaluable tool for scientists, particularly those within the public health and safety sectors. Identifying the culprit behind harmful algal blooms and toxicity in fisheries and recreational waterways is an important job, and sometimes SEM is required to do so. For example, some species of the genus Pseudo-nitzschia, a marine planktonic diatom, produce domoic acid responsible for the neurological disorder Amnesic Shellfish Poisoning (ASP) or domoic acid poisoning (DAP). This neurotoxin can cause short-term memory loss, brain damage, and even death (Clark et al., 1999). Identification of different species can prove to be complicated given that toxigenic and non-toxigenic Pseudo-nitzschia species commonly co-occur in both habitat and samples. In many cases, these species are differentiated by very modest variations in characteristics of the frustule of the organism such as shape, period, and band stria (Lim et al., 2012), valve outline and width, shape of the valve ends, the polarity of the transapical axis, the size of the central interspace, and the length of cell end overlap (Tomas et al., 1997). While many phenotypic markers of the genus can be properly identified under light microscopy, species-specific identification is extremely tedious, time consuming and most often requires the eye of a taxonomic expert (Lim et al., 2012). The defining features are too small to be accurately confirmed via light microscopy (Tomas et al., 1997) because of the limited number and quality of the lenses it uses, as well as the wavelength of light it utilized for illumination. Scanning electron microscopy uses electrons instead of photons to view phytoplankton in depth, making it capable of capturing those modest variations between species of the same genus.
Due to the nature of SEM, the sample must be completely dry before placement within the microscope, unless variable-pressure or environmental SEM is employed. Biological samples are saturated in water, so when they are dehydrated they begin to decompose and shrivel up into unidentifiable masses. This is especially problematic when working with marine life, because the loss of sea water is often leaves salt crystals in the outer membrane, impeding observation of some features. Marine diatoms are more stout than some other phytoplankton because they are protected by a hard, siliceous cell wall called a frustule (Tomas et al., 1997). These protect the diatoms from heavy alterations during electron microscopy processing, and are usually still identifiable under SEM observation. Some flagellates, which are soft bodied, do not tend to preserve well during SEM processing and are difficult to properly classify due to the destruction of key identifying morphological traits.
Different chemical fixation methods can preserve cell morphology and the structural integrity of an organism during specimen preparation for SEM (Hayat, 2000); however, the chemical fixatives used are often highly toxic. Glutaraldehyde is a popular fixative in electron microscopy due to its unique cross-linking properties. As an amine-reactive homobifunctional reagent, glutaraldehyde has two identical aldehyde groups located on either end of a flexible hydrocarbon chain. Both of these aldehyde groups readily react with physically interacting proteins within a cell, forming stable inter- and intra-subunit covalent bonds with existing primary amine groups (Kapoor, 2015). Glutaraldehyde can also react with phospholipids containing free amino groups, further strengthening the cellular connections that give an organism its shape. Metaphorically speaking, glutaraldehyde serves as a ‘glue’ that maintains the internal structural integrity of a cell, so that once the organism dies and undergoes dehydration for observation via electron microscopy it appears well enough preserved to identify some key morphological traits.
In many of the genetic studies reviewed by the California Department of Health and Safety, scientists concluded that long term exposure to glutaraldehyde does not produce genetic mutations in human DNA (DHS, 1995). Even though accidental exposure to vapors or liquid may cause asthma-like respiratory problems and skin, eye, nose, and throat irritations, glutaraldehyde is still a safer chemical to work with in the lab than formaldehyde because it is not a carcinogen. Formaldehyde is another cross-linking chemical fixative that was widely used in electron microscopy, but glutaraldehyde has become the more popular choice due to its high solubility in aqueous solvents and the fact that it contains two aldehyde groups while formaldehyde only has one, making glutaraldehyde a more efficient cross-linker. Another reason for the replacement of formaldehyde with glutaraldehyde is the number of health risks associated with using the chemicals for prolonged periods of time. Formaldehyde, and its aqueous form, formalin, is toxic; if exposed to 0.1 ppm of this gas, an individual could experience an immune response involving any of the following symptoms: a sore throat, chronic coughing, scratchy eyes, and nosebleeds. Formalin, the aqueous form of formaldehyde, is fatal if ingested. Concentrations of 100 ppm are widely accepted to be immediately dangerous to life and health (IDLH), although the National Institute for Occupational Safety and Health (NIOSH) considers any concentration above 20 ppm to be IDLH (OSHA, 2011). Formaldehyde is a known carcinogen, especially for cancer of the nose and throat. The official statement made by the CDC also mentions that in some cases, low levels of exposure resulting in cancer development may be asymptomatic until the cancer has progressed past the point of successful treatment. Given these facts, it is clear that alternative chemical fixatives should be explored to find a less toxic cross-linking equivalent.
In recent biomedical studies, a less toxic cross-linking agent has undergone testing to confirm if glutaraldehyde can be replaced. Genipin, an aglycone chemical compound extracted from the fruit of the gardenia plant, Gardenia jasminoides, has been found to be an exceptional natural cross-linker for proteins, collagen, gelatin, and chitosan cross-linking of tissue grafts in animal studies (JaeSuk Yoo et al., 2011).
Genipin is also known to degrade at a much slower pace than glutaraldehyde, creating stable cross-linked products that are resistant against enzymatic degradation, making it a prime candidate for long term preservation of biological samples (Nickerson et al., 2006). Its use in pharmaceuticals is also increasing in popularity since it has been found to be an excellent regulating agent in drug delivery systems (Manickam et al. 2014). Genipin is an exciting new prospect in cross-linking chemicals, mostly due to its low cytotoxicity of LD50 = 382 mg/kg in mice, intravenously, (Singh, 2011), compared to LD50 = 15.4 mg/kg in mice, intravenously, for glutaraldehyde (Sax and Lewis, 1989).
Genipin could also serve to replace the need for Lugol’s Iodine, a staining agent used in SEM processing. Lugol’s Iodine is a well-known polysaccharide stain that is normally used before the application of cross-linking fixatives in phytoplankton processing. This not only allows for the observation of detailed cell structures in both light microscopy and scanning electron microscopy, but also kills the cells in solution and causes them to sink to the bottom of the container. In previous studies, researchers found that the optimal concentration of Lugol’s Iodine for diatoms tended to be too harsh for the preservation of flagellates (Guiselin et al., 2009). The result consisted of cells with missing or partially dissolved flagella (Guiselin et al., 2009). If genipin provided a stain that was more forgiving than Lugol’s Iodine, perhaps it could replace the need for Lugol’s and successfully preserve the flagella of certain phytoplankton species, making proper identification easier for taxonomists.
The objective of this study was to determine if the use of genipin in place of commonly used chemical fixatives for SEM could produce comparable imaging results. Variables altered to determine if they had an effect on the preservation quality of the phytoplankton included: the percentage of Lugol’s Iodine used; whether or not the sample was centrifuged; whether the sample was chemically fixed using glutaraldehyde, Karnovsky’s fixative, or genipin; the percentage of genipin used; and the absence or addition of sucrose in all concentrations of genipin solution.
MATERIALS AND METHODS
Species
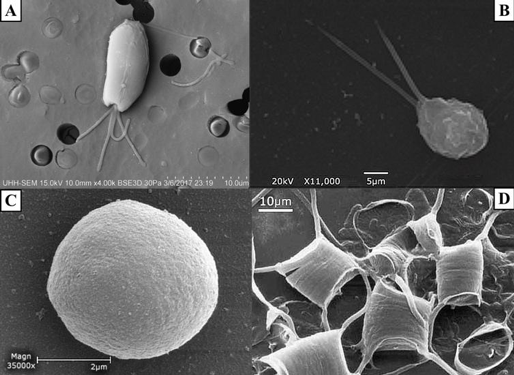
Figure 1. SEM images of A) Tetraselmis chuii (10 µm), B) Isochrysis galbana (5 µm), C) Nannochloropsis granulata (2 µm), and D) Chaetoceros gracilis (10 µm), used throughout the experiment.
Four species of phytoplankton were examined under a variety of processing conditions. These species included three flagellates: Tetraselmis chuii (T. chuii), Nannochloropsis granulate (N. granulate), Isochrysis galbana (I. galbana), and one diatom, Chaetoceros gracilis (C. gracilis) (Figure 1). This allowed for the comparison between the quality of preservation of the soft-bodied, fragile flagellates and the hardy diatoms with tough siliceous cell walls.
The four species were chosen based on availability and were repeatedly cultivated from cultures maintained at the Pacific Aquaculture and Coastal Resources Center (PACRC). This collection method was ideal because it eliminated many confounding variables associated with repeatedly taking ocean water samples, such as the need to control for salinity, pH, temperature, turbidity, weather conditions, nutrient loads, chlorophyll a, algal blooms, runoff, pollution, and other possible differences that may be present if samples are retrieved on different days, times, and locations. Sampling from a controlled batch culture also ensured that the same four species were present every time, and that the key taxonomic markers also appeared when analyzing the resulting scanning electron microscopy photos.
Experiment 1 - Karnovsky’s Fixative
For the first part of the experiment, the UH Hilo protocol, containing 5% Lugol’s Iodine and 2.5% of 50% glutaraldehyde, was compared to Karnovsky’s Fixative, which contained 3% of 50% glutaraldehyde, 2% of 16% formaldehyde, 1 M sucrose, and 0.1 M of 0.2 M sodium phosphate buffer at pH 7.4. This demonstrated how current protocols have greatly improved since the use of Karnovsky’s, which was the first chemical fixative used to preserve phytoplankton described in scientific literature (Sabatini et al. 1963). The percent concentration of Lugol’s Iodine and the effect of centrifugation on the cells were also adjusted to determine if they had any effect on the preservation of the phytoplankton species. The differences between the UH Hilo protocol and Karnovsky’s fixative technique are outlined below (Table 1).
The four samples, each containing one of the target phytoplankton species, were mixed together in a 250 mL Erlenmeyer flask. Six 50 mL Falcon tubes were prepared with Lugol’s Iodine before sampling. Three 50 mL Falcon tubes contained 5% Lugol’s Iodine, and three contained 2.5% Lugol’s Iodine. Then, 20 mL of the mixed sample was added to each 50 mL Falcon tube.
The first Falcon tube (sample #1), containing 5% Lugol’s Iodine, served as the control following the UH Hilo fixation protocol normally used in the laboratory. A total of 0.5 mL of 50% glutaraldehyde was added to the mixture, and placed in an ice bath for two hours. Once the sample was fully saturated in glutaraldehyde, 1.0 mL of the mixture was loaded into a 10 mL syringe connected to a small vacuum manifold, prepared with 3.0 μM Nucleopore membrane filters. The sample was then filtered onto the Nucleopore filter, and immediately placed onto a block of dry ice to flash freeze it. This process was repeated using sample #2 containing 2.5% Lugol’s Iodine.
Samples #3 and #4, containing 5% and 2.5% Lugol’s Iodine, respectively, were placed in a centrifuge at 3,000 rpm for five minutes, resulting in the formation of a phytoplankton pellet. The samples were decanted, and then re-suspended with 10 mL of 2.5% glutaraldehyde solution containing 0.35 M of sucrose and placed in an ice bath for two hours. Once fully saturated, 0.5 mL of both samples were loaded into separate 10 mL syringe connected to a small vacuum manifold, prepared with 3.0 μM Nucleopore membrane filters. The samples were then filtered onto the Nucleopore filters, and immediately placed onto a block of dry ice to flash freeze them.
Samples #5 and #6, containing 5% and 2.5% Lugol’s Iodine, respectively, were placed in a centrifuge at 3,000 rpm for five minutes resulting in the formation of a phytoplankton pellet. The samples were decanted, and then re-suspended with 10 mL of Karnovsky’s fixative and placed in an ice bath for two hours. Both samples were transferred to filters using the same process as samples #3 and #4.
All six filters were then loaded into a large vacuum and allowed to dry overnight in a vacuum. The following morning, the dried filters were labeled and loaded onto aluminum stubs using carbon adhesive tabs. Using colloidal silver paste, silver bridges were applied to all of the sample stubs and then gold coated. The samples were examined in the scanning electron microscope and qualitatively compared to determine the clarity of the key morphological structures for each species.
After the Karnovsky’s experiment results were analyzed, it was noted that the N. granulata cells were often times much smaller than 3.0 µm, which resulted in a high degree of cell loss through the pores of the Nucleopore filters. Thus, the 3.0 µm Nucleopore filters were swapped out for 1.0 µm filters for the remainder of the experiments.
It was also noted that centrifugation played a large roll in eliminating artifacts from the final resulting sample stub. Therefore, centrifugation was made a constant for the remaining experiments.
Experiment 2 - Genipin Fixative
For the second experiment, the use of genipin as a fixative was compared to the protocol that yielded the highest quality SEM images in the first experiment as well as the UH Hilo protocol containing 5% Lugol’s Iodine and 2.5% of 50% glutaraldehyde. Since genipin has never been used as a fixative for phytoplankton cells in scanning electron microscopy, multiple concentrations were tested and are listed in the table below (Table 2).
The four samples, each containing one of the target phytoplankton species, were mixed together in a 250 mL Erlenmeyer flask. Then 20 mL of the mixed sample was added to each of six empty 50 mL Falcon tubes. Two of the 50 mL Falcon tubes, following the UH Hilo protocol guidelines, had 1.0 mL and 0.5 mL, respectively, of Lugol’s Iodine added before centrifugation. All samples were centrifuged at 3,000 rpm for five minutes, resulting in the formation of a phytoplankton pellet. The samples were then decanted and each of four pellets were re-suspended in 10 mL of either 0.5%, 1.0%, 1.5%, or 2.0% of genipin solution containing 40% ethanol and DI H2O. The two pellets containing 5% and 2.5% Lugol’s Iodine, following UH Hilo protocol, received 10 mL of glutaraldehyde solution, which consisted of 2.5% of 50% glutaraldehyde and 0.35 M sucrose. The six samples were then placed in an ice bath for six hours.
Once fully saturated, 1.0 mL of each sample was loaded into 10 mL syringes connected to a small vacuum manifold, prepared with 1.0 μM Nucleopore membrane filters. All six filters were then immediately placed onto a block of dry ice to flash freeze them. The filters were then loaded into a large vacuum and allowed to dry within the vacuum overnight. The following morning, the dried filters were labeled and loaded onto aluminum stubs using carbon adhesive tabs. Using colloidal silver paste, silver bridges were applied to all of the sample stubs and then gold coated. The samples were examined in the scanning electron microscope and qualitatively compared to the most successful fixation method from the first experiment.
Experiment 3 - Genipin Fixative (Part 2)
In the second experiment, an observation was made suggesting that the ethanol required for the protocol was believed to be responsible for the shriveling of the flagellate species. A second set of samples was tested with an addition of sucrose in the genipin solution to mitigate the effects of ethanol seen in the first set of genipin fixation methods (Table 3).
The four samples, each containing one of the target phytoplankton species, were mixed together in a 250 mL Erlenmeyer flask, and 20 mL of the mixed sample was added to each of six empty 50 mL Falcon tubes. One of the 50 mL Falcon tubes served as a negative control, “no treatment”, and 1.0 mL of sample was immediately dispensed in a 10 mL syringe connected to a small vacuum manifold and dispensed onto a 1.0 μM Nucleopore membrane filter. The filter was placed on a block of dry ice to flash freeze before being loaded into a large vacuum to dry overnight. The other five samples were centrifuged at 3,000 rpm for five minutes, resulting in the formation of a phytoplankton pellet. The samples were then decanted, and each of four pellets were re-suspended in 10 mL of either 0.5%, 1.0%, 1.5%, or 2.0% of genipin solution containing 40% ethanol and 0.35 M of sucrose. The fifth sample served as a “no fixative” control, and was re-suspended in 10 mL of 40% ethanol and 0.35 M of sucrose. All five samples were then placed in an ice bath for six hours.
Once fully saturated, 1.0 mL of each sample was loaded into 10 mL syringes connected to a small vacuum manifold, prepared with 1.0 μM Nucleopore membrane filters. All five filters were then immediately placed onto a block of dry ice to flash freeze them. The filters were then loaded into a large vacuum and allowed to dry within the vacuum overnight. The following morning, the dried filters were labeled and loaded onto aluminum stubs using carbon adhesive tabs. Using colloidal silver paste, silver bridges were applied to all of the sample stubs and then gold coated. The samples were examined in the scanning electron microscope and qualitatively compared to all of the other samples from the previous experiments.
Qualitative Assessment of SEM Images
A total of ten images of each species from each fixative protocol were taken and ranked using a three-point scale (Table 4). If any one species was not present or identifiable, they would receive an automatic zero on the three-point scale. In order to receive three points, each species needed to meet specific criteria with regards to species-specific cell structure morphology. N. granulata cells must not have shown signs of any shrinkage. T. chuii cells must have had all four flagella present, clearly identifiable, and must not have shown any visible signs of cell shrinkage. Isochrysis galbana must have had both (2) flagella present, clearly identifiable, and must not have shown any signs of cell shrinkage. C. gracilis cell bodies must have been intact, identifiable, without shrinkage, in conjunction with the presence of all four setae, which must have appeared unbroken.
RESULTS
Processed filters were divided by their respective protocols and mounted onto individual aluminum stubs, which were then labeled and numbered (Table 5). Representative images of each species were taken for each protocol and arranged into a grid for easy viewing and qualitative assessment (Figures 3, 5, 7, and 9). A one-way analysis of variance was then used to compare the average score of each protocol across each of the four species to determine which fixation method was the most successful in maintaining cell morphology (Figures 4, 6, 8, and 10).

A one-way analysis of variance revealed that differences across all 20 fixation methods for T. chuii were statistically significant (F = 7.46, p < .001) with a high degree of variation from a mean score of 0.88 ± 0.41 (Figure 3). The UH Hilo protocol, consisting of 5% Lugol’s Iodine, 2.5% of 50% glutaraldehyde, paired with centrifugation and a two-hour fixation period, had the highest success when fixing T. chuii cells. The genipin solutions containing sucrose, consisting of 0.5%, 1.0%, and 1.5% genipin concentrations, were found to be similar in fixation capabilities to that of the UH Hilo protocol with centrifugation, as indicated by the Tukey HSD test.

Figure 2. Correlative SEM images of T. chuii cells numbered by their respective protocols (Table 5). Scale bar = 10 µM.
The qualitative assessment of SEM images across all protocols supports this statistical finding (Figure 2). The representative T. chuii cell from the UH Hilo protocol, centrifuged and fixed for 2 hours (Figure 2, Panel #3), seemed to maintain the highest degree of its original taxonomic morphology. The representative SEM image also had a low occurrence of artifacts, either on the cell itself or in the surrounding area.

Figure 3. One-Way Analysis of Variance (α = 0.05) and Tukey HSD comparison of average T. chuii image scores across each fixation method. Fixation methods are shorthanded on the X-axis and are referred to in Table 5. Blue bars were non-genipin fixatives and pink bars are genipin fixatives. Error bars ± 1 SE.
A one-way analysis of variance revealed that differences across all 20 fixation methods for I. galbana were statistically significant (F = 7.63, p < .001) around an overall mean score of 0.72 ± 0.39 (Figure 5). The UH Hilo protocol, consisting of 5% Lugol’s Iodine, 2.5% of 50% glutaraldehyde, paired with centrifugation and a 6-hour fixation period, was the most successful in fixing Isochrysis galbana cells. The genipin solution without sucrose, consisting of 1.0% genipin, was found to be similar in fixation capabilities to that of the UH Hilo protocol with centrifugation, as indicated by the Tukey HSD test.

Figure 4. Correlative SEM images of I. galbana cells numbered by their respective protocols (numbered images refer to protocols tested in Table 5). Scale bar = 5 µM.
The qualitative assessment of SEM images across all protocols (Figure 4) did not reflect this statistical finding. Images for I. galbana were collected well after the filters were ready for SEM analysis and stub deterioration had already begun.
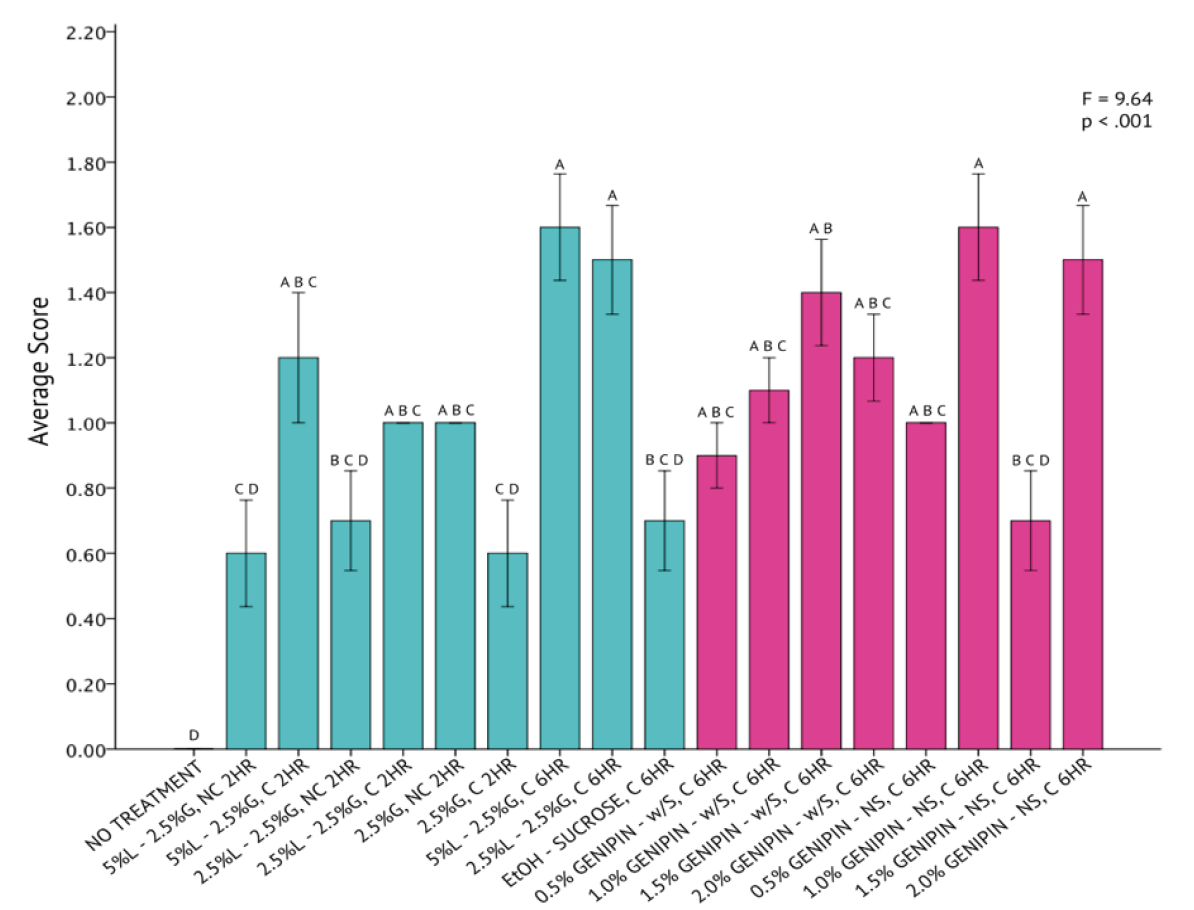
Figure 5. One-Way Analysis of Variance (α = 0.05) and Tukey HSD comparison of average I. galbana image scores across each fixation method. Fixation methods are in shorthand on the X-axis and are referred to in Table 5. Blue bars were non-genipin fixatives and pink bars are genipin fixatives. Error bars ± 1 SE.
A one-way analysis of variance statistical test revealed that differences across all 20 fixation methods for C. gracilis were statistically significant (p < 0.001) with a high degree of variation (F = 11.17) from a mean score of 1.05 ± 0.44 (Figure 9). The genipin solutions, consisting of 0.5% and 1.0% genipin, without sucrose, were both determined to be the most successful in fixing C. gracilis cells. Averages between the two protocols were identical. All protocols consisting of genipin had a higher rate of success fixing C. gracilis cells than any other methods explored, as indicated by the Tukey HSD test. Although the UH Hilo protocol, paired with centrifugation and fixed for six hours, fell well below the average compared to the genipin protocols, it was still considered significantly similar to the most successful protocols, as indicated by the Tukey HSD test.

Figure 6. Correlative SEM images of N. granulata cells numbered by their respective protocols (numbered images refer to protocols tested in Table 5). Scale bar = 2 µM.
The qualitative assessment of SEM images across all protocols supports this statistical finding (Figure 8). The representative C. gracilis cells from the 0.5% and 1.0% genipin solution without sucrose (Figure 8, Panels #17 and #18), seemed to maintain the highest degree of their original taxonomic morphology. Both representative SEM images had a low co-occurrence of artifacts either on the cell itself or in the surrounding area. All other genipin treatments (Figure 8, Panels #12-15 and #17-20) also appeared to have the lowest degree of cell breakage, presence of artifacts, or loss of setae compared to all other non-genipin fixation methods.
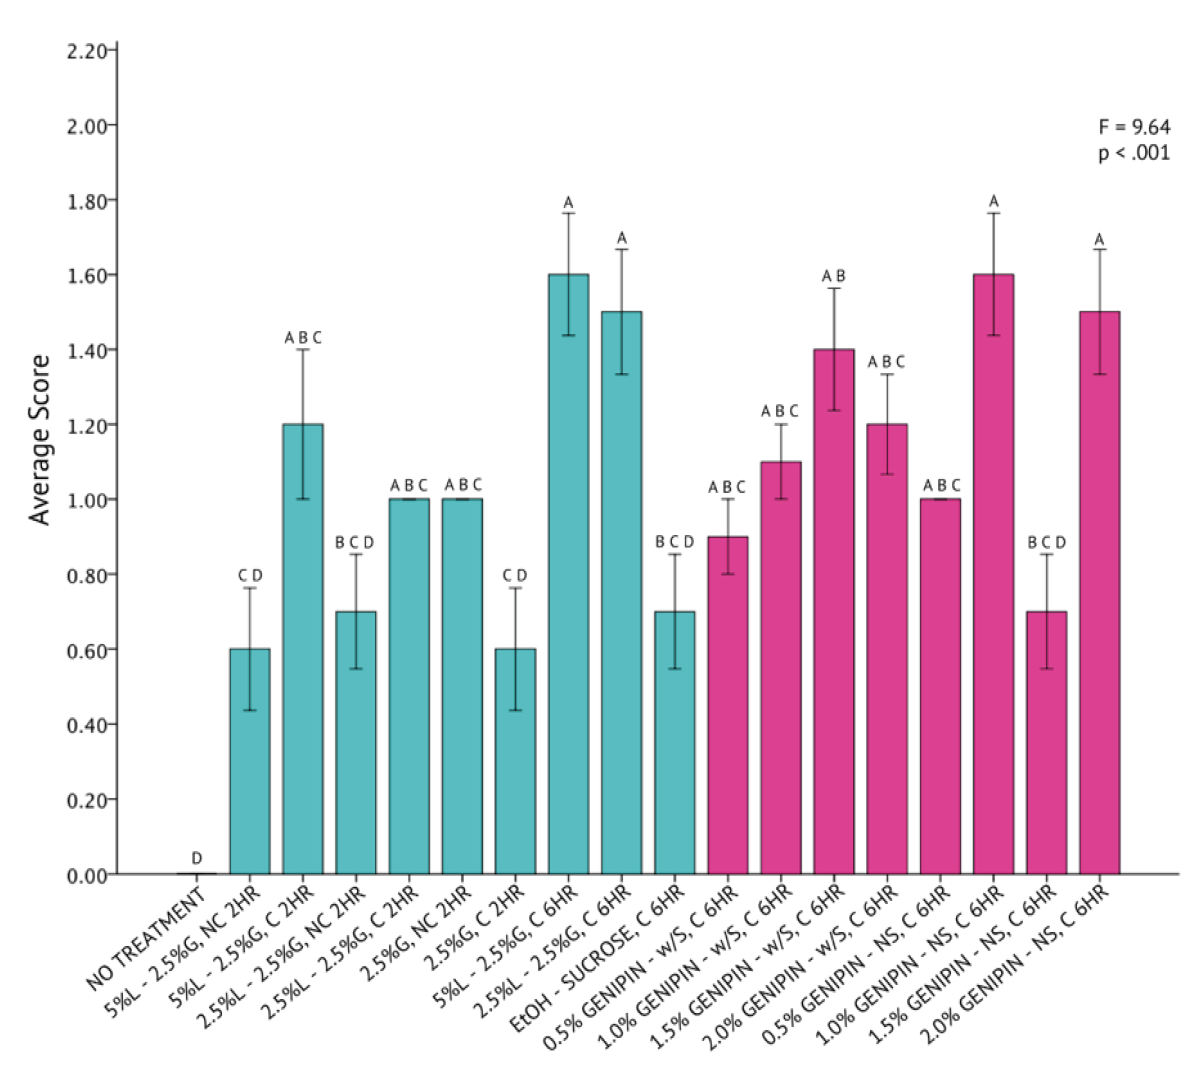
Figure 7. One-Way Analysis of Variance (α = 0.05) and Tukey HSD comparisons of average N. granulata image scores across each fixation method. Fixation methods are in shorthand on the X-axis and refer to table 5. Blue bars were non-genipin fixatives and pink bars are genipin fixatives. Error bars ± 1 SE.
DISCUSSION
The objective of this study was to determine which phytoplankton processing and fixation method, either novel or previously explored in the scientific literature, would yield the most successful preservation and enhanced quality of the resulting SEM images used for species identification.
Experiment 1 - Karnovsky’s Fixative

Figure 8. Correlative SEM images of C. gracilis cells numbered by their respective protocols (numbered images refer to protocols tested in Table 5).
This experiment demonstrated how current protocols have greatly improved since the use of Karnovsky’s, which was the first chemical fixative used to preserve phytoplankton described in the scientific literature (Sabatini et al., 1963).
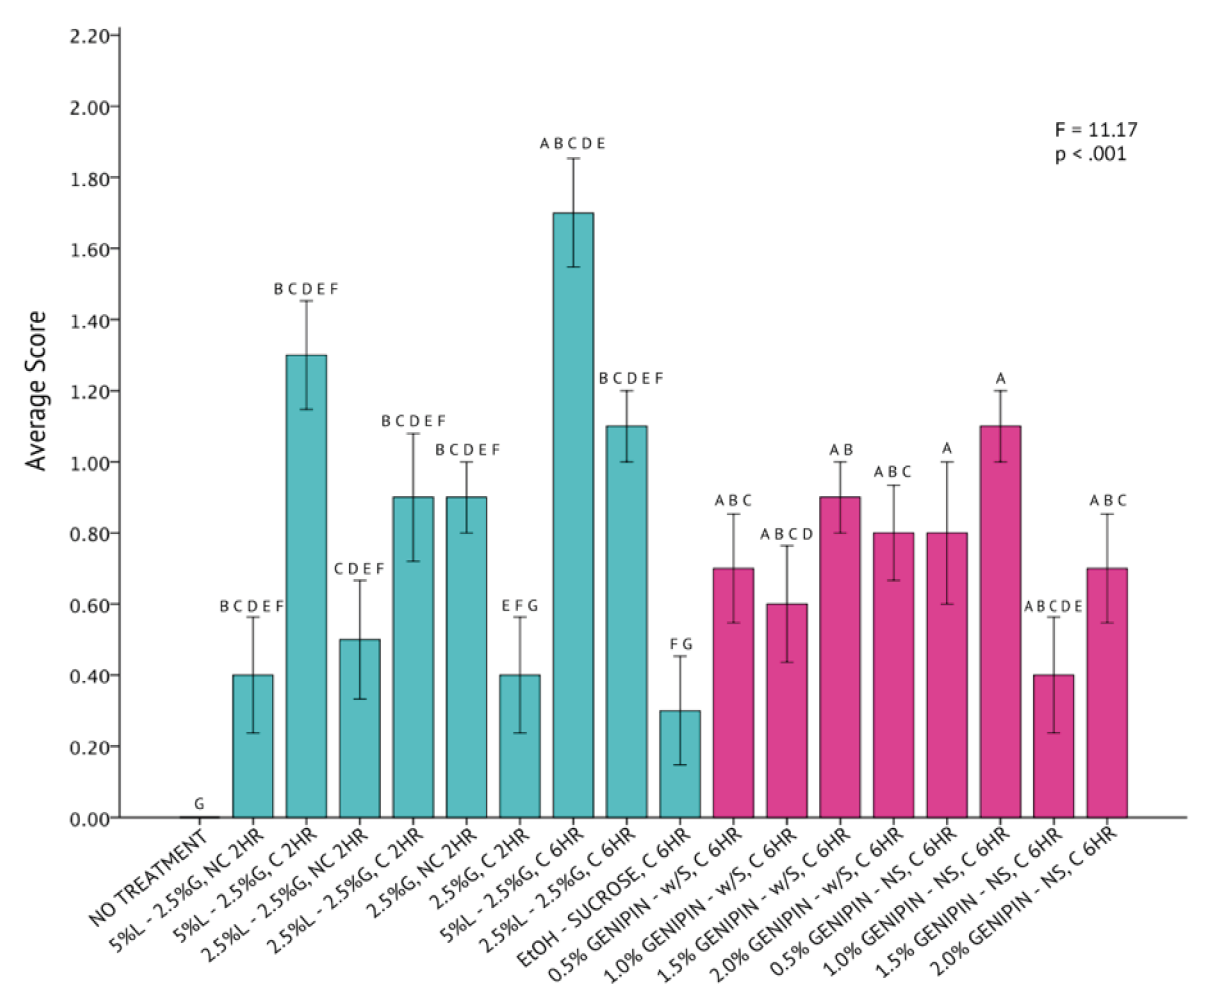
Figure 9. One-Way Analysis of Variance (α = 0.05) and Tukey HSD comparisons of average C. gracilis image scores across each fixation method. Fixation methods are in shorthand on the X-axis and refer to table 5. Blue bars were non-genipin fixatives and pink bars are genipin fixatives. Error bars ± 1 SE.
From the results, it was determined that the UH Hilo protocol, containing 5% Lugol’s Iodine and 2.5% of 50% glutaraldehyde, paired with centrifugation, yielded the highest score and quality of preserved cells when compared with samples fixed using Karnovsky’s protocol. The Karnovsky’s fixative samples were not well-preserved, and resulted in “melting” of the cells to the filter. This is due to the fact that formaldehyde has only one aldehyde group at the end of its carbon chain while glutaraldehyde has two – one on either end of the carbon chain (Sabatini et al., 1963). Therefore, this study reflected the consensus that glutaraldehyde is better suited for binding and cross-linking cells than formaldehyde, which is one of the reasons why glutaraldehyde is a far more popular fixative used in phytoplankton preservation for SEM analysis.
Samples that did not undergo centrifugation presented with numerous artifacts, as well as cell cracking and melting. The most common artifacts observed were salt crystals. By centrifuging the samples and decanting the saltwater before adding a fixative, a majority of the salt was removed and thus unable to saturate and crystallize on the filter post-dehydration. As a result of this finding, centrifugation has since been added as one of the steps described in the UH Hilo protocol, and all subsequent samples in this study underwent centrifugation.
Experiment 2 - Genipin Fixative
The first portion of the genipin experiment revealed that diluting genipin in ethanol caused the flagellate species to shrivel. Thus, a second set of samples were fixed in an alternative solution of genipin with the addition of sucrose to help mitigate the effects of ethanol on the cells. The staining capabilities of genipin were not apparent in any of the fixed samples, and due to time restrictions, these capabilities were not explored further. In previous research, samples were left for days or weeks before being analyzed (Suk Yoo et al., 2011). It was assumed that the amount of time the samples were allowed to fix in the genipin solution (six hours) was a contributing factor to the lack of blue stain.
Qualitative Comparison
From the results, it was clear that no singular treatment proved most successful across all of the species tested. Tetraselmis chuii and I. galbana cells were best fixed using the UH Hilo standard protocol with centrifugation, but with variations in fixation time. N. granulata and C. gracilis cells were best fixed in either 0.5% or 1.0% genipin solutions, but both protocols were too statistically similar to the other genipin treatment variations to definitely confirm their superiority. This is a promising finding, considering the objective of this study was to determine if genipin could measure up and replace glutaraldehyde for processing phytoplankton for scanning electron microscopy. To generalize, however, fixation with 1% genipin solutions produced comparable results to standard fixation protocols involving Lugol’s iodine and glutaraldehyde. Future experiments starting from 1% genipin solutions likely hold the most promise for further development of this protocol for phytoplankton SEM.
Figures 2, 4, 6, and 8 were representative photos for each protocol collected after the individual stubs were scored and reflect far more stub deterioration and artifacts than what was originally observed, especially with regards to the photos for I. galbana.
Limitations
For the diatom species, C. gracilis, cells often appeared to be over-fixed. This became apparent when examining cell chains. Proper taxonomic morphology includes spacing between individual cells that make up the diatom chain. Almost all chains observed, across all variations of genipin treatments, presented as multiple solid, fused cells. Further research is needed to determine the mechanisms responsible for this occurrence, and other diatom species should be tested to determine if this result is species – specific or due to an interaction between the biochemical composition of diatoms as a group and the cross-linking capabilities of genipin.
Conclusions
From this qualitative study, it was found that genipin is a promising alternative fixative to glutaraldehyde. Genipin may be beneficial in the long run because it is much safer for researchers to use in the laboratory, especially if they are working independently or lack proper safety equipment. It is also capable of fixing cells at a much lower concentration than glutaraldehyde, making genipin cheaper to use and store for prolonged periods of time. Future research should determine the best solution and concentration of genipin to use based on species-specific experiments since this research suggests species may have different reactions to fixation in genipin.
ACKNOWLEDGMENTS
This project would not have been possible without the assistance of Dr. Jason Adolf, chair of the Marine Science Department at University of Hawai’i at Hilo, as well as the staff from the Analytical Lab in the Marine Science Department at University of Hawai’i at Hilo.
REFERENCES
Clark, R. F., Williams, S. R., Nordt, S. P., & Manoguerra, A. S. (1999). A Review of Selected Seafood Poisonings. Undersea Hyperbaric Medicine, 26(3), 175–184.
Department of Health and Safety (1995). Department of Health and Safety: Glutaraldehyde, available: https://www.cdph.ca.gov/programs/hesis/Documents/glutaral.pdf.
Goldstein, J., Newbury, D. E., Michael, J. R., Ritchie, N. W., Scott, J. H. J., & Joy, D. C. (1992). Scanning Electron Microscopy and X-Ray Microanalysis: A text for Biologists, Materials Scientists, and Geologists, 2nd ed., New York: Plenum Press.
Guiselin, N., Courcot, L., Artigas, L.F., Le Jéloux, A., & Brylinski, J.M. (2009). An optimized protocol to prepare Phaeocystis globose morphotypes for scanning electron microscopy observation. Journal of Microbiological Methods, 77(1), 119-123.
Hayat, M. A. (1981). Principles and techniques of electron microscopy. Biological applications. London: Edward Arnold.
James Cook University, Australia. (2016). Biological Sample Preparation for the SEM. Cairns Advanced Analytical Center, available: https://research.jcu.edu.au/archive/enabling/aac/cairns-aac/biological-sample-preparation-for-the-sem.
Jones, I. (2010). Scanning Electron Microscopy (Imaging) [PDF Document]. Retrieved from Electron Microscopy Group, University of Birmingham, available: https://bhamem.files.wordpress.com/2010/12/sem-1_dec2010.pdf.
Kapoor, M. (2015). How to cross-link proteins. Cellular, Molecular, and Microbial Biology Division, University of Calgary, Calgary, Canada, T2N 1N4.
Lim, H. C., Leaw, C. P., Su, S. N. P., Teng, S. T., Usup, G., Mohammad-Noor, N. Lundholm, N., Kotaki, Y., & Lim, P. T. (2012). Morphology and molecular characterization of Pseudo-nitzschia (Bacillariophyceae) from Malaysian Borneo, including the new species Pseudo-nitzschia circumpora sp. nov. Journal of Phycology, 48(5), 1232-1247.
Manickam, B., Sreedharan, R., & Elumalai, M. (2014). ‘Genipin’ - The natural water soluble cross-linking agent and its importance in the modified drug delivery systems: An overview. Current Drug Delivery, 11(1), 139-145.
Nickerson, M.T., Patel, J., Heyd, D.V., Rousseau, D., & Paulson, A.T. (2006). Kinetic and mechanistic considerations in the gelation of genipin-crosslinked gelatin. International Journal of Biological Molecules, 39(4-5), 298-302, doi: 10.1016/j.ijbiomac.2006.04.010.
Occupational Safety and Health Administration (2011). Formaldehyde factsheet [PFD Document]. Retrieved from Occupational Health and Safety Administration. Available: https://www.osha.gov/OshDoc/data_General_Facts/formaldehyde-factsheet.pdf.
Sabatini, D.D., Bensch, K., & Barrnett, R.J. (1963). Cytochemistry and Electron Microscopy: The Preservation of Cellular Ultrastructure and Enzymatic Activity by Aldehyde Fixation. The Journal of Cell Biology. 17(1), 19-58.
Sax, N.I., Lewis, R.J. (EDS.) (1989). Glutaraldehyde. In Dangerous Properties of Industrial Materials, 7th ed., New York: Van Nostrand Reinhold.
Singh, A. (2011). Chapter 5: Phytochemicals - Genipin. Herbalism, Phytochemistry, and Ethnopharmacology, New York: CRC Press.
Suk Yoo, J., Kim, Y.J., Kim, S.H., & Choi, S.H. (2011). Study on Genipin: A new alternative natural crosslinking agent for fixing heterograft tissue. Korean Journal of Thoracic Cardiovascular Surgery, 44(3), 197-207, DOI: 10.5090/kjtcs.2011.44.3.197.
Tomas, C.R., Haste, G. R. (1997). Identifying Marine Phytoplankton. New York: Academic Press.
Touyama, R., Inoue, K., Takeda, Y., Yatsuzuka, M., Ikumoto, T., Moritome, N., Shingu, T., Yokoi, T., Inouye, H. (1994). Studies on the blue pigments produced from Genipin and Methylamine. II. On the formation mechanisms of brownish-red intermediates leading to the blue pigment formation. Chemical and Pharmaceutical Bulletin. 42(8), 1571-1578.
University of Oklahoma (2004). Limits to Resolution in the Electron Microscope. available: http://www.ou.edu/research/electron/bmz5364/resolutn.html.
Watt, I.M. (1997). The Principles and Practice of Electron Microscopy, 2nd ed., New York: Cambridge University Press.