
Authors: Hoi Ting Yeung and Marcus Pui Hei Man
Institution: School of Biomedical Sciences, Li Ka Shing Faculty of Medicine, the University of Hong Kong, Pokfulam, Hong Kong SAR, China
ABSTRACT
Mitochondrial proteins are vital regulators of cellular metabolism, with their roles ranging from energy generation to cell apoptosis. Furthering our understanding of the structures and spatio-temporal dynamics of mitochondrial proteins is therefore central to the elucidation of various metabolic mechanisms. Mitochondrial metabolic disorder is one of the most commonly inherited human diseases. Despite its prevalence, it is difficult to be diagnosed at early stages because of the disparate disease genotypes and phenotypes. Thus, advancing means of cataloguing the extensive mitochondrial proteome is crucial for clarifying the pathogenesis of mitochondrial diseases. Such information would provide considerable insight into the improvement of current diagnostic and therapeutic approaches for the disorders. The requirement of purification and the low resolution of conventional imaging techniques impede the study of mitochondrial proteins in situ. Recent developments of imaging techniques, such as single molecule holography, photoactivated localization microscopy (PALM), and stimulated emission depletion (STED), allow for the visualization of proteins down to single molecule resolution in situ. This enables direct study of protein activity mechanisms with considerations of the contributions given by their native environments. In this review, we summarize the limitations of conventional structural techniques, such as X-ray crystallography, nuclear magnetic resonance (NMR) spectroscopy, and cryo-electron microscopy (cryo-EM), specific to studying mitochondrial proteins. Three emerging techniques, including single molecule holography, PALM, and STED, are then discussed as to how they overcome the limitations of the conventional techniques and generate greater understanding of mitochondrial proteins. This knowledge has significant implications for advancing diagnostic methods and therapeutic approaches for mitochondrial diseases.
INTRODUCTION
The Necessity of Studying Mitochondrial Proteins
Mitochondrial proteins are important regulators of cell fate. The mitochondrion houses glutamate dehydrogenase, succinate dehydrogenase, adenylate kinase, cytochrome oxidases and a myriad of other enzymes involved in the process of ATP production via the Krebs cycle and electron transport chain (Pagliarini & Rutter, 2013). Responsible for over 90% of ATP production in our most energy-consuming organs, mitochondrial proteins are important supporters of cellular activities and perform the vital role of coupling the consumption of nutrients to energy production (Tarasov et al., 2012). However, the mitochondrion does much more than provide energy. The discovery of cytochrome C, the electron carrier of the electron transport chain, partakes in apoptotic pathways (Pagliarini & Rutter, 2013). During apoptosis, cytochrome C is released from mitochondria via mitochondrial outer membrane permeabilization (MOMP), which in turn triggers a cascade of events that lead to the degradation of the cytoplasm and nucleus (Pagliarini & Rutter, 2013; Parsons & Green, 2010). This process has a key part in innate immunity, with cell deaths alerting the immune system of infections. In addition to controlling cell death, mitochondria’s role in calcium ion homeostasis and the synthesis of iron-sulfur proteins further supports the plethora of roles mitochondrial proteins play in various cell signalling pathways (Tait & Green, 2012).
Although these functions were discovered long ago, their detailed mechanisms are still unknown. MitoCarta, the most extensive mitochondrial protein database, suggests that the mitochondrial proteome still largely remains unchartered (Pagliarini & Rutter, 2013). Approximately a quarter of the catalogued genes are not annotated in gene ontology, suggesting significant knowledge gaps in the characterization of mitochondrial proteins. Given the proteins’ diverse roles, it is unsurprising that mitochondrial protein dysfunction underpins a spectrum of metabolic disorders that are genetically and phenotypically heterogeneous (Nunnari & Suomalainen, 2012). Such disorders, ranging from inborn metabolic errors to the more common neurodegenerative diseases and diabetes, plague children and adults alike (Calvo & Mootha, 2010; Lin & Beal, 2006; Szendroedi et al., 2012). Accordingly, a more comprehensive understanding of both the dynamic structures of the proteins and their complex interplay with neighbouring proteins should be developed. This would achieve more timely and definite diagnoses when used with current genomic diagnostic approaches, which can quickly identify possible causative mutations in mitochondria-associated genes (Pagliarini & Rutter, 2013). However, the conventional structural proteomics techniques such as cryo-electron microscopy (cryo-EM), nuclear magnetic resonance (NMR) spectroscopy and X-ray crystallography all exhibit different limitations in their depiction of mitochondrial proteins (Smith et al., 2000). One of the major insufficiencies of these techniques is that they provide an understanding of the averaged properties of the whole system instead of the diversified individual roles of proteins (Best et al., 2006; Watson et al., 2005).
Limitations of Conventional Techniques
Cryo-electron microscopy makes use of high energy electron beams to penetrate protein molecules and form a 2D projection of the protein on the detector screen (Figure 1B). As many protein molecules are fixed on the metal grid, virtually all orientations of the protein are captured (Bai et al., 2015). With the use of mathematical manipulations, the 3D structure of the protein is reconstructed (Sigworth, 2016). A pure solution of the protein in question is required for providing meaningful information, so the mitochondrial proteins cannot be in their native environment with their interacting partners. The individual differences of the same protein are also eliminated in the process of combining 2D projections. Thus, cryo-EM is limited in studying mitochondrial protein functions in detail.
Protein NMR is on the other end of the spectrum; it provides too much detail about protein structures. Nuclear magnetic resonance spectroscopy measures the magnetic and chemical environments of individual atoms. Protein folding can be inferred from the differences of chemical environments among atoms (Billeter et al., 2008). The information provided by NMR is highly precise down to atomic scales. However, this precision produces a highly complicated spectrum resulting from complex atomic interaction, which limits the possible size of the studied protein to about 25kDa (Billeter et al., 2008). As with cryo-EM, a pure solution is needed for protein NMR analysis, which is not optimal for the level of details required for mitochondrial protein study.
X-ray crystallography is currently the most commonly used structural proteomics technique, but also faces the most challenges in solving protein structures (Shi, 2014). For a protein to be characterized by X-ray crystallography, it must first be crystallized to form a regular array. A high energy X-ray beam is then diffracted by the crystal to form a diffraction pattern (Figure 1C). With the use of Fourier transform, the protein structure can be re-constructed from the diffraction pattern. However, crystals have to be formed from pure proteins using specific buffers (Ilari & Savino, 2008). In the process of crystallization, proteins may adopt a conformation different to that of their native environment. The process of crystallization is limited by the symmetry of the folded protein and may not be possible for all proteins. These drawbacks make X-ray crystallography a rather inefficient way to study mitochondrial proteins.
Confocal microscopy and co-immunoprecipitation have been the predominant methods to study protein localization and interaction. Sample processing, such as cell fixation, cell lysis, and vigorous washing, prior to analyses masks the real activities in physiological conditions. Since confocal microscopy directly images fluorescence signals produced by proteins, it faces the problem of diffraction limits in conventional microscopes due to the small size of mitochondrial tubules between 250 nm and 500 nm (Kroemer & Reed, 2000). Co-immunoprecipitation is more technically simple, yet it provides limited information about the interactions, including subcellular localization. Techniques that incorporate the resolution of confocal microscopy and technical simplicity of co-immunoprecipitation would improve the overall process of studying mitochondrial proteins.
Super-Resolution Image Technologies Solve Problems of Conventional Techniques
Molecular holography solves single protein structures using the diffraction pattern from low energy electron beams diffracted by the protein molecule. The resulting hologram, a 2D record of 3D wave information is then obtained (T. Latychevskaia et al., 2015). Image averaging is not required because electrons can be detected with a high sensitivity. Sample preparation is easier than X-ray crystallography because a mass analyser is used to separate single protein species from the bulk (Longchamp et al., 2017).
Super-resolution imaging techniques such as PALM and two-colour STED microscopy provide an optical resolution below 50nm, which can overcome the diffraction barrier and record 3D coloured images. Early implementation of these techniques on labelled proteins within mitochondria, such as the outer membrane protein Tom20, allowed the visualization of individual cristae (Schmidt et al., 2008; Shim et al., 2012). In one particular study, the distribution of Tom20 clusters was analysed using STED. It clearly showed the differential distribution of Tom20 clusters on the mitochondrial membrane under varying conditions, such as the cell culture method and mitochondria positions in the cells (Wurm, et al., 2011). These distributions demonstrated that protein dynamics can be well-visualized down to the small size of mitochondria. These results illustrate that the inability of studying in situ protein structures and dynamics can be overcome by recently-developed super-resolution microscopy techniques, which are advantageous for unravelling protein structures that relate to their physiological functions.
MOLECULAR HOLOGRAPHY ELUCIDATES SINGLE PROTEIN STRUCTURES WITH HIGH RESOLUTION
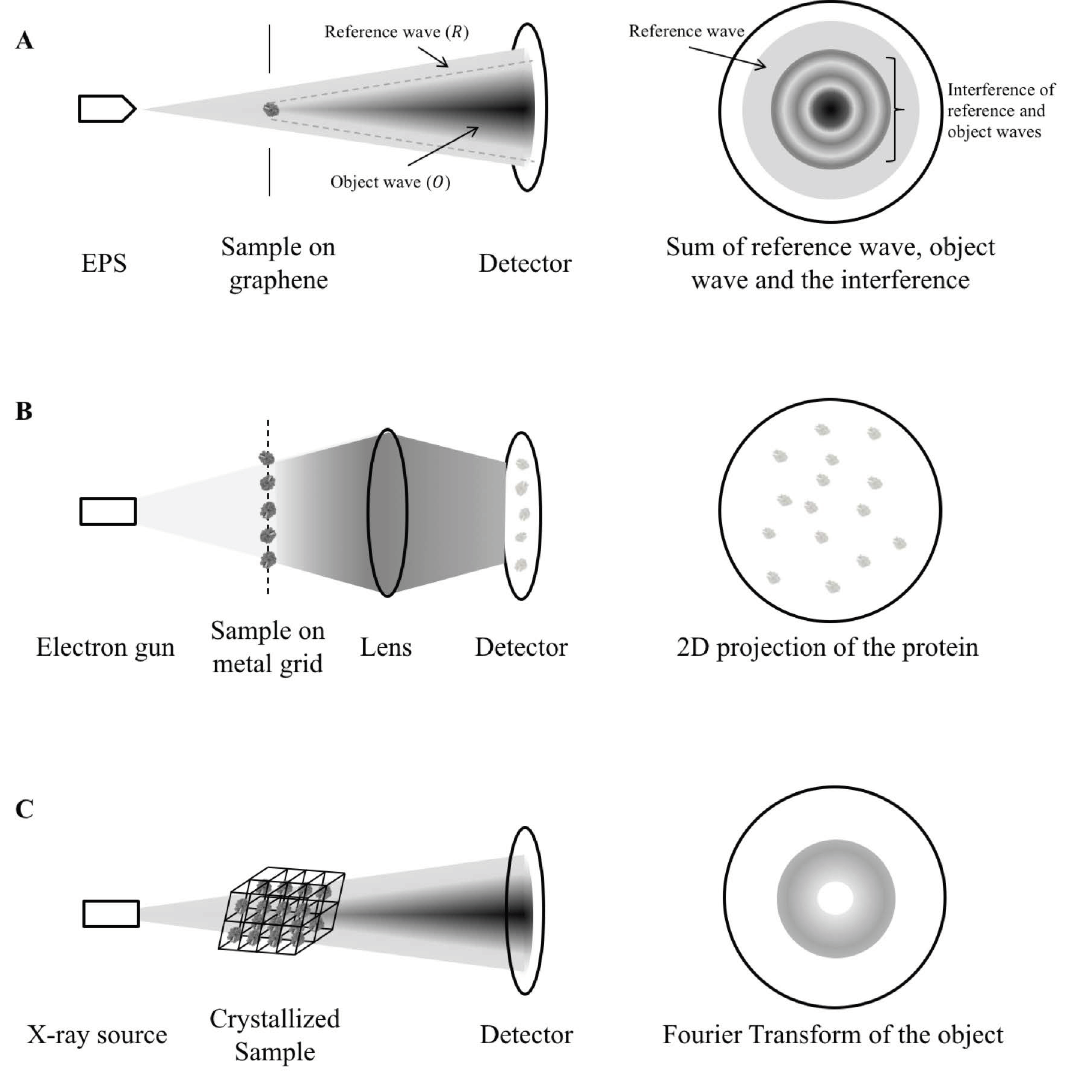
Figure 1. Mechanism comparison between holography, cryo-EM and X-ray crystallography. A) A coherent, low-energy electron beam is ejected by EPS and directed to the sample deposited on a graphene sheet. The hologram is a sum of the reference wave (electrons not scattered by the protein, R), object wave (electrons scattered by the protein, O) and the interference between the two. As shown in the figure, some reference waves do not interfere with the object wave and so it retains the phase information. The structure of the sample is calculated from separating the contribution by the object wave from the hologram and reversing the scattering process as described in detail in (Tatiana Latychevskaia & Fink, 2015). B) In cryo-EM, a high-energy electron gun, instead of a coherent electron point source is directed to the sample cryo-preserved on a metal grid. The high-energy electrons can be transmitted easily (in contrast to be scattered) across the protein sample and produce direct 2D projection of the protein samples onto the detector. The exact protein structure is constructed by averaging the images of different orientations instead of through calculation from a single protein. C) In X-ray crystallography, parallel X-ray beams are diffracted by the crystallized sample. As the reference wave is absent, the phase information is missing to reconstruct the protein structure, giving rise to the “phase problem”. This makes X-ray crystallography inferior to holography in terms of structure determination. EPS: electron point source.
Molecular holography is an amalgamation of mass spectrometry, cryo-EM, and X-ray crystallography (Figure 1). The combination of these techniques eliminates the drawback of the individual counterparts, such as inefficient sample preparation and inability to study individual proteins, while also producing structures of better resolution and quality. Molecular holography allows protein molecules to diffract electrons from a point source in contrast to the parallel electron or X-ray beam used in cryo-EM and X-ray crystallography (Figure 1A compared to 1B, C). Electrons from a point source form a spherical wave, with only a portion of the wave scattered by the protein (T. Latychevskaia et al., 2015). The scattered portion of the wave contains the protein structural information while the remaining portion retains the original phase information. The combination reconstructs protein structures and has shown promise in deducing the structures of a few proteins, including cytochrome C (Longchamp et al., 2017).
Sample Preparation
Protein sample is separated prior to hologram measurement using a mechanism similar to that of mass spectrometry. The protein sample is first subjected to electrospray ionization to produce ions with different mass-to-charge (m/z) ratio (Figure 1A). As the m/z ratio is directly related to the identity and the folding of the protein, the ions are then selected by a time-of-flight mass analyser. Pressure is then applied to the selected ion, which is deposited onto an inert graphene sheet to measure the hologram. The carbon atoms are smaller than metal atoms used in the metal grid in cryo-EM, which minimize electron diffraction during hologram measurement as a possible source of noises.
Hologram Measurement
The graphene sheet with the protein sample mounted is transferred to construct the hologram. Low-energy coherent electron beams are directed to the sample. The electron beam is set to an energy range of 50-250 eV (T. Latychevskaia et al., 2015), thousands of times lower than that used in cryo-EM (>60 keV) (Kotakoski et al., 2014) or X-ray crystallography (5-10 keV). This energy range allows continuous imaging without damaging the protein (Germann et al., 2010). The protein sample does not need to be frozen for protection as in cryo-EM, so protein dynamics can be studied using holography (Longchamp et al., 2017).
Object Reconstruction
Object reconstruction can be conducted by analysing the interference pattern and background reference wave intensity. The object wave carrying the structure information is reconstructed by reversing the interference process using the Fresnel–Kirchhoff diffraction integral (Tatiana Latychevskaia & Fink, 2015). On the other hand, the reference wave is measured in a separate control experiment and the phase information is easily extracted. By combining the structure information extracted from the object wave and the phase information from the reference wave, the protein structure can be determined.
Advantages of Molecular Holography over the Conventional Techniques
Molecular holography can resolve many of the insufficiencies of conventional techniques, such as X-ray crystallography and cryo-EM. The use of mass analyser for sample preparation is more efficient than the biochemical ways used in X-ray crystallography and cryo-EM. First, it does not require protein crystallization, which can be challenging for some proteins. Second, any solvents or buffers can be used to dissolve the protein of interest. Thus, the protein will still be in its native environment until it is ionized. The protein structure obtained using molecular holography will then highly resemble the in situ structures. Additionally, membrane proteins which require a hydrophobic environment can also be studied in this way. Finally, protein separation is less crucial because different proteins will have vastly different molecular ion profiles and can be easily separated in the mass analyser.
Since X-ray cannot be bent by lens, parallel beams of X-ray are used to perturb protein structures in X-ray crystallography. Consequentially, solving structures is much more challenging for X-ray crystallography. This is because the diffraction pattern recorded loses the phase information of the waves which are diffracted by the protein, contributing to the “phase problem” (Figure 1C). However, electron waves from a point source used in holography are spherical and only a small portion is scattered by the protein molecule (Figure 1A). The un-scattered reference wave still carries the phase information of the wave, which can be used to calculate the protein structure. Therefore, the phase information does not have to be obtained through separate experiments like in the case of X-ray crystallography, contributing to another advantage of holography.
Coincidently, a point source is more amenable to mechanical vibrations, which are currently challenging to eliminate and report relatively low-resolution structure (about 7Å) (Longchamp et al., 2017). This problem, however, is not existent when a parallel beam of electrons (called “coherent diffraction imaging”) is used as in X-ray crystallography or cryo-EM. Therefore, a combination of holography and coherent diffraction imaging was suggested to improve resolution to 2 Å and solve the phase problem with the hologram (T. Latychevskaia et al., 2015).
TRACKING 3D LOCALIZATION OF PROTEINS BY PALM
Despite the fact that high-resolution structures of proteins can be obtained using holography, the actual in situ localizations and interactions cannot be inferred using this method because of the protein sample purification requirement. Within cells, proteins interact with different partners and often translocate to different organelles to exert their functions. Currently, fluorescence microscopy is used to track proteins carrying a fluorescent tag. However, because light diffraction is significant at the molecular level, it is difficult to resolve closely-spaced proteins, even in the case when the two proteins are labelled with different fluorescent tags (Bates et al., 2013). Therefore, the concepts of PALM or Stochastic Optical Reconstruction Microscopy (STORM) have been developed (Bates et al., 2013; Zhong, 2010).
In PALM, proteins do not have to be purified for the study. Instead, specific fluorescent dyes used to track the protein of interest are incorporated into the cells as in conventional fluorescence microscopy. They can either be expressed as fusion proteins or added externally using fluorophore-tagged antibodies. The method is more efficient and technically simpler than structural proteomics techniques. More importantly, it allows the study of proteins in situ, which presumably retains the native activities of the protein. After tagging the protein of interest with fluorescent dyes, PALM can be performed on the cultured cells directly.

Figure 2. Mechanism of Photoswitching in Cy5 Dye. A) Cy5 is fluorescent in its native state. Upon irradiation by red light (632 nm), Cy5 is excited and fluoresce C). In the excited state, thiolate ions in the buffer solution react with the fluorescent Cy5 and inactivate it. In the reaction, the π conjugation system (highlighted in red) is shortened from 20 bonds to two systems of 8 and 10 bonds. This shortening increases the HOMO-LUMO gap (B), and so the dye does not fluoresce under irradiation of red light (C). The inactivated state is reactivated by irradiation of green light (535 nm) in the presence of Cy3.
The core concept of PALM is photoswitchable fluorescent dyes. During imaging, a subset of photoswitchable dyes is activated by a weaker laser pulse rather than the strong pulse used in conventional fluorescence microscopy to activate all fluorophores. As energy absorption by a fluorophore is frequency-dependent rather than intensity-dependent, the laser intensity can be optimized so that the activated fluorophores are not overlapping (Rust et al., 2006). The activated fluorophores are then excited by laser of a different frequency. These excited fluorophores fluoresce and simultaneously react to be inactivated. This photoswitching cycle is mediated by photochemical reactions which change the length of the π system. The most commonly used dyes are the cyanine dyes (e.g. Cy5 and Cy3). The Cy5 dye fluoresces and reacts with a thiolate compound present in the buffer under red light to shorten its π system from 20 bonds to two π systems of 8 and 10 bonds respectively (Figure 2A). This shortened π system has an increased “highest occupied molecular orbital-lowest unoccupied molecular orbital” (HOMO-LUMO) gap which forbids electron transitions to produce fluorescence, inactivating Cy5 (Figure 2B, C). The more reactive inactivated dye, because of shortened π conjugation, regains its fluorescence by losing the thiolate group with the help of the Cy3 dye upon irradiation of green light (Dempsey et al., 2009; Yan et al., 2011). This process is repeated until all labelled proteins are imaged. Finally, the images are merged to produce the high-resolution image (Figure 4A).
As cells are three-dimensional, it is more comprehensive to deduce the location of proteins with reference to the overall 3D cell rather than the 2D projection as in conventional microscopy. Interferometric PALM (iPALM) was developed to deduce the 3D position of proteins based on the concept of PALM. It has been used to study the three-dimensional architecture of the cell, including cytoskeleton (Wang & Kanchanawong, 2016), and mitochondria nucleoid (Brown et al., 2011; Kopek et al., 2012). These studies showed the capability of iPALM to elucidate the 3D position of mitochondrial proteins with respect to the background organelles.
A cellular sample that requires imaging by PALM is prepared similarly to the method used in conventional fluorescent microscopy and the PALM excitation paradigm is applied. However, a completely different microscope is required. The sample to be imaged is placed between two identical objectives (“4π system”, Figure 3). When a fluorophore is excited, the light wave is transmitted simultaneously through both objectives to a three-way beam splitter interferometer. Because of the difference in the position of the fluorophore relative to the two objectives, the path lengths travelled by the two waves are different. These two waves interfere with one another in the interferometer and split into three beams which are recorded by CCD cameras. Experimental results agreed with theoretical calculations which showed that the waves detected by the cameras are out of phase by 120° and have different intensities because of their path lengths (Shtengel et al., 2009). From the camera recordings, the axial position of the fluorophore can be obtained using a calibration curve or theoretical calculations. The individual axial coordinates are finally assigned to each fluorophore and presented as a contour plot.
The three waves with different phases produced by the interferometer give at least two distinct intensity values at all possible positions of the fluorophore for internal calibration (Figure 3). The measurement of relative position also provides better precision. As the light beams to be interfered are produced directly from the fluorophore, the result of their interference is the best indicator of the position of the fluorophore because no estimations have to be performed on the image.

Figure 3. Interferometric PALM makes use of an interferometer to determine the position of proteins in 3D space. The sample is placed on the stage of the microscope as usual (defined as the x-y plane). Upon irradiation by laser, the fluorophore (green circle) emits light which passes through both objectives. As the fluorophore may locate at different positions in the z axis, the path lengths and intensities of the light rays passing through the two objectives are different. In the interferometer, these light rays interfere with one another. With the careful design of the interferometer, three distinct signals can be detected by CCD Camera 1, 2 and 3 respectively. From theoretical calculations and experiments, it was shown that the phases of the three interfered waves differed by exactly 120°. As shown by the approximate sketch of the interfered waveforms (Red: Camera 1; Blue: Camera 2; Green: Camera 3), any values of z can be determined specifically from the intensity measured. Each of the points z are also covered by at least 2 points, which assists calibration. CCD: charge-coupled device.
Interferometric PALM images the target fluorophore with high resolution which is crucial for studying the small mitochondria. This high resolution was demonstrated in a study of the mitochondrial nucleoid complex (Brown et al., 2011). The complex is made up of mitochondrial DNA (mtDNA), proteins and RNA. Because of the close proximity of the three components, it is challenging to elucidate the exact architecture of the complex using traditional imaging technologies. With the use of iPALM, the nucleoid complex was shown to exist in multiple conformations which were not resolved using conventional fluorescence microscopy. The architecture of the whole nucleoid complex was also unambiguously deduced (Brown et al., 2011). On the other hand, iPALM is only sensitive to the targets tagged by a fluorescent tag. In effect, this can be viewed as iPALM taking the proteins of interest out of the surrounding network. This is contradictory to our discussions here. To solve this problem, a modification of iPALM was suggested (Kopek et al., 2012; Shtengel et al., 2014). It was shown that iPALM can be used in conjunction with electron microscopy (EM). After imaging the sample with iPALM, the sample was then further analysed by EM. Interferometric PALM gives the fine details of the cell, while EM shows the overall cellular context of the proteins. This combination does not only show the flexibility of iPALM in the context of cellular imaging, but also opens the possibility of EM in studying individual proteins, which was previously not widely used because of the technical complexity and inaccuracy of staining.
STED MICROSCOPY RESOLVES SUB-MITOCHONDRIAL PROTEIN LOCALIZATION AND INTERACTIONS AT NANOSCALE THROUGH GROUND STATE DEPLETION
Resolving sub-mitochondrial protein distributions is often met with challenges, with the size of mitochondria bordering the resolution limit of diffraction-limited microscopy (Jakobs, et al., 2010). Stimulated emission depletion microscopy bypassed this diffraction limit and has captured nanoscale spatial distributions and interaction of proteins at the mitochondria. This exceeds the limit of conventional microscopy, including confocal microscopy (Figure 4).

Figure 4. Mechanism comparison between PALM, STED and confocal microscopy. A) Sample readout from PALM. Photoswitchable fluorescent probes are stochastically activated. The precise single-molecular positions of excited fluorophores are detected, without the hindrance of signal overlap-ping in the case of simultaneous adjacent excitations. This imaging cycle is repeated with a different set of stochastically excited fluorophores. Images obtained from all imaging cycles are superimposed to create a final fluorophore density map of single-molecular resolution. (b) Sample readout from STED. A donut-shaped STED laser pattern suppresses fluorescence emission from fluorophores peripheral to the excitation laser. Fluorescent emission is restricted to a single focal point, thus conveying increased resolution. Fluorescent probes are activated sequentially via scanning until an entire spatial readout is obtained. This reliance on excitation-patterning contrasts with the single-molecule localization method in PALM. (c) Sample readout from confocal imaging. Fluorescent probes are simultaneously activated within a diffraction zone. Overlapping of fluorescent events hinders precise single-molecular localization, thus limits the resolution of images produced. STED: stimulated emission depletion.
In STED, fluorescent signals peripheral to a desired focal point are suppressed with a STED laser. This is done by interrupting the transition of an excited fluorophore to its ground state. Since the fluorophore is now forced to de-excite into a higher energy state, the photon released is of a higher wavelength than of a photon released in normal ground state transitioning (Müller et al., 2012). These signals from a shifted-wavelength can then be cancelled out with diffractive optical elements (Török & Munro, 2004). This patterning of fluorescent signals reduces the area over which fluorescent emissions are spread at the outer regions of the excitation point (Figure 4B; (Hell & Wichmann, 1994; Huang, 2010). Signal patterning leaves a single focal point in emitting fluorescent signals thus provides increased clarity of the image obtained.
Stimulated emission depletion microscopy has been employed to study a number of mitochondrial proteins. Nanoscale spatial localization of the translocase of the outer membrane (TOM) complexes in relation to F1F0ATP synthase at the mitochondrial membrane was resolved using a variant of this technique, dual-coloured STED. Enrichment of TOM translocase machinery at sites where the inner and outer mitochondrial membrane are in close proximity has previously been reported (Reichert & Neupert, 2002). However, the exact spatial arrangements of TOM complexes were indistinct when portrayed by diffraction-limited techniques. In dual-coloured STED, the α-subunit F1F0ATP synthase and the Tom20 subunit of the TOM complex are tagged with green and red fluorophores, respectively. It was then showed for the first time that TOM complexes are arranged in nanoclusters against a background of homogenously arranged F1F0ATP synthases (Donnert et al., 2007). Given F1F0ATP synthases are found at the inner membrane while TOM complexes at the outer, insights can be drawn with regards to TOM cluster formation and their correlation with other mitochondrial structures with the use STED microscopy (Donnert et al., 2007).
Additionally, the localization of different human mitochondrial porin (hVDACs) isoforms and the extent to which they each co-localize with hexokinase-1 had also been largely obscured by conventional fluorescence microscopy. Through dual-coloured STED, a detailed account of the localization of the different isoforms is obtained. While hVDAC1 and hVDAC2 are located chiefly within distinct regions at the outer membrane, hVDAC3 is homogenously arranged throughout the mitochondrial surface (Neumann et al., 2010).
In the case of mitochondrial proteins, the STED framework can also give information or complement research that addresses more precise biochemical problems with regards to kinetics. Via quantitative analysis of dual-coloured STED images, it was discovered that hexokinase-I co-localizes at a higher degree with hVDAC3 than with hVDAC1 or hVDAC2 (Neumann et al., 2010). These data demonstrate varying levels of binding affinity between hexokinase-I and the different isoforms of the same molecule, revealing interaction differences that were previously unanticipated. This implies STED can help deduce the distinctive interaction profiles of proteins with regard to subtle molecular differences. STED is therefore useful in providing preliminary data that paves way for future kinetic studies or complementary data that confirms already established kinetic studies. Stimulated emission depletion microscopy in conjunction with quantitative co-localization analysis can impart valuable insights in the delineation of the molecular basis of mitochondrial protein binding. This is especially useful in teasing apart the behavioural differences of protein isoforms produced by different alleles of the same mitochondrial protein gene.
Stimulated emission depletion microscopy is preferable to PALM in some regards. Since the principle behind STED mainly lies on the spatial patterning of light emissions, selection of appropriate fluorophores is less important in STED than in PALM, which is made possible by the photoswitching ability of fluorophores (Huang, 2010). Stimulated emission depletion microscopy is less limited by the choice of fluorophores in that sense.
Although STED is powerful in comprehending nanoscale localizations to delineate interactions of mitochondrial proteins, it also has some limitations. One of the limitations of the technique is the need for large number of incident photons for signal elimination. This implies image resolution positively correlates with STED laser strength. Since high intensity lasers predispose fluorophores to photobleaching, it should be noted that there is a compromise between signal retention and image resolution (Dyba & Hell, 2003). Moreover, PALM is less prone to errors produced by the optical system. While STED relies heavily on the perfection of zero at the center of the depletion pattern, PALM averages the position of fluorescent signals to resolve an image (Figure 4A, B; (Huang, 2010). Photoactivated localization microscopy also permits higher resolution than STED, with PALM displaying precision down to ~10 nm laterally and axially compared with the ~30 nm lateral and axial resolution of STED (Maglione & Sigrist, 2013). These limitations give PALM a slight edge over STED.
In any case, the application of STED to TOM complex and mitochondrial porin studies has proven the usefulness of the technique in inferring how mitochondria perform its critical functions via precise imaging of protein localizations and interactions. The use of STED in elucidating integral mitochondrial functions has demonstrated the importance of using physics methods to further studies of biological systems.
CONCLUSION AND FUTURE PERSPECTIVES
We have provided ample evidence that the emergence of super-resolution imaging techniques has contributed greatly to the characterization of unannotated mitochondrial proteins. With mitochondrial metabolic disorders being one of the most commonly inherited disease clusters in humans that plagues all ages alike, devising strategies that allow early identification of mitochondrial diseases is imperative to the timely delivery of suitable therapies (Schaefer et al., 2004). Development of these strategies requires systematic delineation of the functions of mitochondrial proteins. Super-resolution imaging technologies have proven to be valuable in defining the structures and co-localization patterns of these proteins. This information provides significant insight on the functions of these proteins. Better annotation of the complex mitochondrial proteome would have substantial implications for the future development of mitochondrial disorder diagnostics and therapies, benefiting patients of a plethora of mitochondrial diseases.
Revelations of structural and cellular co-localization information of mitochondrial proteins have been limited by conventional imaging techniques due to their limited resolution. While one can benefit from atomistic resolution of protein structures with conventional structural imaging techniques such as X-ray crystallography and NMR, characterizing proteins out of their native biological environment questions the authenticity of these structures to their true in-cell identity. Moreover, information with regard to the structural fluidity of proteins is also lost when structures are obtained by averaging images with conventional biophysical techniques.
In terms of structural elucidation, molecular holography, a technique that unifies conventional mass spectrometry, cryo-EM, and X-ray crystallography, has been developed to give high resolution structures while eliminating the drawback of losing information due to averaging of data. Difficulties in crystallizing membrane proteins can also be evaded with this technique since crystals are not required. The protein structures resolved by molecular holography are a more accurate reflection of their in situ states as proteins can be kept in their native environments until ionization without the need for specific solvents to solvate them. All of these characteristics give molecular holography an edge over conventional techniques. Mitochondrial protein cytochrome C is among the few proteins structures resolved by this newly developed technique, implying its suitability for further resolving the extensive catalogue of mitochondrial proteins with high accuracy (Longchamp et al., 2017).
To give authentic accounts of the in situ dynamics of mitochondrial proteins, PALM and STED have been essential to the delineation of nanoscale spatial arrangements and interactions of sub-mitochondrial proteins. With the size mitochondria at the resolution limit of conventional optical microscopy, the study of sub-mitochondrial structures had largely been impractical. However, super-resolution imaging approaches filled this gap by demonstrating the precise localization and co-localization information via bypassing diffraction limits. The suggestion that co-localization data can lay dependable groundwork for more precise biochemical research such as kinetic studies demonstrates the usefulness of PALM and STED. By understanding the variations in kinase binding preferences to different protein isoforms, the molecular basis of mitochondrial protein binding can also be better deduced (Neumann et al., 2010).
Super-resolution imaging techniques combine biophysical theories with advances in computational and engineering approaches to achieve meaningful data practically. The development of these techniques paints a more reliable picture of mitochondrial protein structure and in situ protein dynamics. We have illustrated that a comprehensive framework of mitochondria has been extensively driven by super-resolution technologies. A well-annotated mitochondrial protein catalogue is imperative to advancing current mitochondrial medicine strategies. Mitochondrial diseases have traditionally been difficult to diagnose, with a broad spectrum of genotypic and phenotypic manifestations ranging from comparatively rare neonatal respiratory chain deficiencies to the more common type II diabetes and neurodegenerative diseases (Calvo & Mootha, 2010; Lin & Beal, 2006; Szendroedi et al., 2012). A well-defined inventory of mitochondrial proteins is especially useful when used in combination with genomic diagnostic approaches. The well-established system of genomic diagnostics together with a comprehensively annotated mitochondrial proteome can greatly improve the efficiency of diagnosis and the prescription of appropriate treatments. Moreover, precise mapping of the mitochondrial proteome can impart important insights on possible cures for mitochondrial diseases, which can currently only be mediated through palliative approaches (Suomalainen, 2011). Super-resolution technologies have brought and will continue to bring forth advancements in our understanding of mitochondrial physiology down to molecular levels, holding promises for future cures for mitochondrial diseases.
ACKNOWLEDGMENTS
The manuscript is based on the coursework for the undergraduate course “Essential Proteomics” offered by the University of Hong Kong. We would like to express our thanks to Dr. Julian A. Tanner for his mentorship throughout the process of idea conception and manuscript writing. We appreciate the contributions by Mr. Timmy Chow in outlining the manuscript. We have special thanks to Dr. William Cheung MY, Faculty of Science, University of Hong Kong for his kind help in the process of literature review. We would also like to thank the anonymous reviewers from the course for their constructive comments, which have helped us refine the article.
REFERENCES
Bai, X.-C., McMullan, G., & Scheres, S. H. (2015). How cryo-EM is revolutionizing structural biology. Trends in Biochemical Sciences, 40(1), 49-57.
Bates, M., Jones, S. A., & Zhuang, X. (2013). Stochastic optical reconstruction microscopy (STORM): a method for superresolution fluorescence imaging. Cold Spring Harbor Protocols, 2013(6), pdb. top075143.
Best, R. B., Lindorff-Larsen, K., DePristo, M. A., & Vendruscolo, M. (2006). Relation between native ensembles and experimental structures of proteins. Proceedings of the National Academy of Sciences, 103(29), 10901-10906.
Billeter, M., Wagner, G., & Wüthrich, K. (2008). Solution NMR structure determination of proteins revisited. Journal of Biomolecular NMR, 42(3), 155-158.
Brown, T. A., Tkachuk, A. N., Shtengel, G., Kopek, B. G., Bogenhagen, D. F., Hess, H. F., & Clayton, D. A. (2011). Superresolution fluorescence imaging of mitochondrial nucleoids reveals their spatial range, limits, and membrane interaction. Molecular and Cellular Biology, 31(24), 4994-5010.
Calvo, S. E., & Mootha, V. K. (2010). The mitochondrial proteome and human disease. Annual Review of Genomics and Human Genetics, 11, 25-44.
Dempsey, G. T., Bates, M., Kowtoniuk, W. E., Liu, D. R., Tsien, R. Y., & Zhuang, X. (2009). Photoswitching mechanism of cyanine dyes. Journal of the American Chemical Society, 131(51), 18192-18193.
Donnert, G., Keller, J., Wurm, C. A., Rizzoli, S. O., Westphal, V., Schönle, A., Jahn, R., Jakobs, S., Eggeling, C., & Hell, S. W. (2007). Two-color far-field fluorescence nanoscopy. Biophysical Journal, 92(8), L67-L69.
Dyba, M., & Hell, S. W. (2003). Photostability of a fluorescent marker under pulsed excited-state depletion through stimulated emission. Applied Optics, 42(25), 5123-5129.
Germann, M., Latychevskaia, T., Escher, C., & Fink, H.-W. (2010). Nondestructive imaging of individual biomolecules. Physical Review Letters, 104(9), 095501.
Hell, S. W., & Wichmann, J. (1994). Breaking the diffraction resolution limit by stimulated emission: stimulated-emission-depletion fluorescence microscopy. Optics Letters, 19(11), 780-782.
Huang, B. (2010). Super-resolution optical microscopy: multiple choices. Current Opinion in Chemical Biology, 14(1), 10-14.
Ilari, A., & Savino, C. (2008). Protein structure determination by x-ray crystallography. Bioinformatics (pp. 63-87): Springer.
Jakobs, S., Stoldt, S., & Neumann, D. (2010). Light microscopic analysis of mitochondrial heterogeneity in cell populations and within single cells. High Resolution Microbial Single Cell Analytics (pp. 1-19): Springer.
Kopek, B. G., Shtengel, G., Xu, C. S., Clayton, D. A., & Hess, H. F. (2012). Correlative 3D superresolution fluorescence and electron microscopy reveal the relationship of mitochondrial nucleoids to membranes. Proceedings of the National Academy of Sciences, 109(16), 6136-6141.
Kotakoski, J., Mangler, C., & Meyer, J. C. (2014). Imaging atomic-level random walk of a point defect in graphene. Nature Communications, 5, 3991.
Kroemer, G., & Reed, J. C. (2000). Mitochondrial control of cell death. Nature Medicine, 6(5), 513.
Latychevskaia, T., & Fink, H.-W. (2015). Practical algorithms for simulation and reconstruction of digital in-line holograms. Applied Optics, 54(9), 2424-2434.
Latychevskaia, T., Longchamp, J. N., Escher, C., & Fink, H. W. (2015). Holography and coherent diffraction with low-energy electrons: A route towards structural biology at the single molecule level. Ultramicroscopy, 159 Pt 2, 395-402. doi:10.1016/j.ultramic.2014.11.024
Lin, M. T., & Beal, M. F. (2006). Mitochondrial dysfunction and oxidative stress in neurodegenerative diseases. Nature, 443(7113), 787.
Longchamp, J.-N., Rauschenbach, S., Abb, S., Escher, C., Latychevskaia, T., Kern, K., & Fink, H.-W. (2017). Imaging proteins at the single-molecule level. Proceedings of the National Academy of Sciences, 114(7), 1474-1479.
Maglione, M., & Sigrist, S. J. (2013). Seeing the forest tree by tree: super-resolution light microscopy meets the neurosciences. Nature Neuroscience, 16(7), 790.
Müller, T., Schumann, C., & Kraegeloh, A. (2012). STED microscopy and its applications: new insights into cellular processes on the nanoscale. ChemPhysChem, 13(8), 1986-2000.
Neumann, D., Bückers, J., Kastrup, L., Hell, S. W., & Jakobs, S. (2010). Two-color STED microscopy reveals different degrees of colocalization between hexokinase-I and the three human VDAC isoforms. PMC Biophysics, 3(1), 4.
Nunnari, J., & Suomalainen, A. (2012). Mitochondria: in sickness and in health. Cell, 148(6), 1145-1159.
Pagliarini, D. J., & Rutter, J. (2013). Hallmarks of a new era in mitochondrial biochemistry. Genes & Development, 27(24), 2615-2627.
Parsons, M. J., & Green, D. R. (2010). Mitochondria in cell death. Essays in Biochemistry, 47, 99-114.
Reichert, A. S., & Neupert, W. (2002). Contact sites between the outer and inner membrane of mitochondria—role in protein transport. Biochimica et Biophysica Acta (BBA)-Molecular Cell Research, 1592(1), 41-49.
Rust, M. J., Bates, M., & Zhuang, X. (2006). Sub-diffraction-limit imaging by stochastic optical reconstruction microscopy (STORM). Nature Methods, 3(10), 793.
Schaefer, A. M., Taylor, R. W., Turnbull, D. M., & Chinnery, P. F. (2004). The epidemiology of mitochondrial disorders—past, present and future. Biochimica et Biophysica Acta (BBA)-Bioenergetics, 1659(2), 115-120.
Schmidt, R., Wurm, C. A., Jakobs, S., Engelhardt, J., Egner, A., & Hell, S. W. (2008). Spherical nanosized focal spot unravels the interior of cells. Nature Methods, 5(6), 539.
Shi, Y. (2014). A glimpse of structural biology through X-ray crystallography. Cell, 159(5), 995-1014. doi:10.1016/j.cell.2014.10.051
Shim, S.-H., Xia, C., Zhong, G., Babcock, H. P., Vaughan, J. C., Huang, B., Wang, X., Xu, C., Bi, G.-Q., & Zhuang, X. (2012). Super-resolution fluorescence imaging of organelles in live cells with photoswitchable membrane probes. Proceedings of the National Academy of Sciences, 109(35), 13978-13983.
Shtengel, G., Galbraith, J. A., Galbraith, C. G., Lippincott-Schwartz, J., Gillette, J. M., Manley, S., Sougrat, R., Waterman, C. M., Kanchanawong, P., & Davidson, M. W. (2009). Interferometric fluorescent super-resolution microscopy resolves 3D cellular ultrastructure. Proceedings of the National Academy of Sciences, 106(9), 3125-3130.
Shtengel, G., Wang, Y., Zhang, Z., Goh, W. I., Hess, H. F., & Kanchanawong, P. (2014). Imaging cellular ultrastructure by PALM, iPALM, and correlative iPALM-EM. Methods in Cell Biology (Vol. 123, pp. 273-294): Elsevier.
Sigworth, F. J. (2016). Principles of cryo-EM single-particle image processing. Microscopy, 65(1), 57-67.
Smith, W. L., DeWitt, D. L., & Garavito, R. M. (2000). Cyclooxygenases: structural, cellular, and molecular biology. Annual Review of Biochemistry, 69(1), 145-182.
Suomalainen, A. (2011). Therapy for mitochondrial disorders: little proof, high research activity, some promise. Paper presented at the Seminars in Fetal and Neonatal Medicine.
Szendroedi, J., Phielix, E., & Roden, M. (2012). The role of mitochondria in insulin resistance and type 2 diabetes mellitus. Nature Reviews Endocrinology, 8(2), 92.
Tait, S. W., & Green, D. R. (2012). Mitochondria and cell signalling. Journal of Cell Science, 125(4), 807-815.
Tarasov, A. I., Griffiths, E. J., & Rutter, G. A. (2012). Regulation of ATP production by mitochondrial Ca^2+. Cell Calcium, 52(1), 28-35.
Török, P., & Munro, P. (2004). The use of Gauss-Laguerre vector beams in STED microscopy. Optics Express, 12(15), 3605-3617.
Wang, Y., & Kanchanawong, P. (2016). Three-dimensional Super Resolution Microscopy of F-actin Filaments by Interferometric PhotoActivated Localization Microscopy (iPALM). Journal of Visualized Experiments: JoVE(118).
Watson, J. D., Laskowski, R. A., & Thornton, J. M. (2005). Predicting protein function from sequence and structural data. Current Opinion in Structural Biology, 15(3), 275-284.
Wurm, C. A., Neumann, D., Lauterbach, M. A., Harke, B., Egner, A., Hell, S. W., & Jakobs, S. (2011). Nanoscale distribution of mitochondrial import receptor Tom20 is adjusted to cellular conditions and exhibits an inner-cellular gradient. Proceedings of the National Academy of Sciences, 108(33), 13546-13551.
Yan, Y., Marriott, M. E., Petchprayoon, C., & Marriott, G. (2011). Optical switch probes and optical lock-in detection (OLID) imaging microscopy: high-contrast fluorescence imaging within living systems. Biochemical Journal, 433(3), 411-422.
Zhong, H. (2010). Photoactivated localization microscopy (PALM): an optical technique for achieving~ 10-nm resolution. Cold Spring Harbor Protocols, 2010(12), pdb. top91.