
Authors: Haris Moazam Sheikh, Zeeshan Shabbir, Muhammad Hissaan Ali Chatha, Chaudhary Ahmed Sharif, Muhammad Hamza Waseem, Umar Asif
Institutions: Department of Mechanical Engineering, University of Engineering and Technology, G.T. Road, Lahore, Punjab 54890, Pakistan
Department of Electrical Engineering, University of Engineering and Technology, G.T. Road, Lahore, Punjab 54890, Pakistan
ABSTRACT
The increased popularity of micro-satellites puts great demand for precise measurement of thrust and impulse bits. Conventional methods cannot be used for this purpose because the extremely low values are significantly affected by background noise. This paper explains the development of a test bench to measure thrust between 0.1 and 1.0mN and impulse bits between 0.01 and 1mNs for micro-electro-mechanical systems (MEMS) based micro-thrusters. This methodology was formulated for the design of model and parameter testing of micro-satellites at the Institute of Space Technology, Pakistan. A vertical pendulum system was modeled with its governing parameters. The theoretical system was designed using inputs from existing models. A micro-scale laser displacement sensor was used to measure response of the system, and the results obtained were validated using Simulink. The dynamic modeling and the design methodology can be used to design any hanging pendulum test bench and has been adopted by the Institute of Space Technology, Pakistan. The test bench can be employed for very precise thrust and impulse measurement of micro-scale thrusters of satellites.
INTRODUCTION
The requirement for precise positioning and movement of satellites is increasing with the advancement in space technology and the last decade has seen a steady increase in interest in micro-technology. This, in turn, has increased the need for precise thrust and impulse measurement techniques for micro-scale thrusters and considerable effort is being invested to achieve precision (Mueller, Hofer, & Ziemer, 2010; Spence et al., 2013).
The sensitivity and accuracy of a thrust bench depends on its mode of measurement and the sensor itself. Direct and indirect measurements are both used today, but direct measurements are given preference because of better precision in the case of micro-satellites. If the thruster itself is mounted on the bench, it gives direct measurement of the force, but if the exhaust of the thruster is used to produce deflection, it is an indirect method (Bijster, 2014; Janssens, 2009; Zandbergen, Janssens, Valente, Perez-Grande, & Koopmans, 2010). Problems in indirect measurements are associated with unknown elasticity of the momentum exchange between the exhaust plume particles and the target (Jean-Yves, 2006). Thrust measuring techniques can use force transducers or measure the deflection of the pendulum through different approaches.
Load cells are widely used in modern day test benches (Lamprou, Lappas, Shimizu, Gibbon, & Perren, 2011; Pancotti, Lilly, Ketsdever, Aguero, & Schwoebel, 2005). They work well for high thrust devices, but in the case of micro-thrusters which have low thrust to mass ratios, the load cell measurement is affected by the thruster weight (Polk et al., 2013). The availability of load cells with sufficient sensitivity permitted their introduction to low thrust measurement applications. Advantages conferred through the use of load cells are high accuracy over a wide measurement range due to their high degree of linearity, the limiting of thrust stand motion to very small values, and prompt readings. There is no need for time-consuming force-displacement calibrations during which thermal drift may introduce uncertainty into the measurement (Pancotti et al., 2005).
Steady state thrust measurement is increasingly becoming popular, particularly with more accurate and sensitive controls being developed. The method is to determine an unknown force in a laboratory environment and track slowly developing variations in that force. A steady state null balance accomplishes this by applying a control force to cancel thrust stand deflection caused by the unknown force (Janssens, 2009). When deflection has been nullified, the control force is assumed to be equal to the unknown force. However, the use of the system is limited because of inaccuracy that may be introduced by the controls themselves. Thrust and impulse benches that are currently used are classified based on their structure and configuration: hanging pendulum, inverted pendulum, torsion balances, swinging gates and folded pendulum.
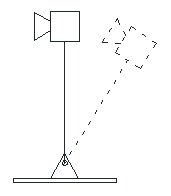
Figure 1. Inverted pendulum system.
Hanging pendulum configurations with direct or indirect thrust measurement are the most popular for test benches today because of their inherent stability and simple design (Packan, Bonnet, & Rocca, 2007; Zandbergen et al., 2010). However, high stability requires relatively longer pendulum arms that may be too long for the available vacuum chambers (Xu & Walker, 2009).
For steady state measurements, inverted pendulum configurations are used (Figure 1). Also known as null type, they are highly unstable. Extremely high sensitivity makes them difficult to be controlled (Bijster, 2014). Actuators are installed to keep the system in equilibrium. Sensitivity can be adjusted by varying the stiffness of load spring or flexures (Xu & Walker, 2009).
Recent models have proved torsion balance to be a very stable system for thrust and impulse bit measurement. The system incorporates a torsion spring that counters the effect of applied thrust, provides restoring force independent of the thruster mass, and gives high sensitivities (Soni, Zito, & Roy, 2013; Yang, Tu, Yang, & Luo, 2012). The advantage of this system is that, unlike other systems, no long arms are needed for sensitivity. The most profusely used type in the torsion balance system is swinging gate pendulum in which the rotation axis is aligned with the local gravitational vector. This renders the restoring force totally independent of the thruster mass (Khayms, 2000; Zandbergen et al., 2010).

Figure 2. Folded pendulum system.
The folded pendulum or the Watts pendulum (Figure 2) is used for small thrust stands. It consists of a horizontal bar supported on one end by a simple pendulum and on the other end by an inverted pendulum. When it is excited, the center of mass of the horizontal bar moves in a straight line. The period of the pendulum is controlled by moving the center of mass forward or backward (Wilson, Bushman, & Burton, 1997). The advantage of a long period is that it allows the application of high frequency impulses without exciting any resonance with a small thrust stand. High sensitivity and low stiffness to external loads result from the counteracting stabilizing motion of the hanging pendulum and the unstable motion of the inverted pendulum (Luna, Edwards, Del Amo, & Hughes, 2011; Sutherland, Appolloni, O’Neil, Gonzalez del Amo, & Hughes, 2008).

Figure 3. Flexure system.
Flexure systems (Figure 3) are used when testing space is small; however, their use is restricted because of their specificity. A flexure system designed for a specific thruster is usually not readily available for a new thruster type. The thruster is connected to the center of a flexure that vibrates upon firing of the thruster. The motion is measured through a Michelson interferometer and the impulse bit can then be derived by the dynamics of the flexure. The advantages of this type of thrust stand are small size, controllable sensitivity, and high resonance frequency (Emhoff, Simon, & Land, 2007).
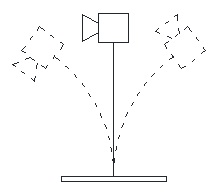
Figure 4. Resonant blade system.
A much more restricted bench is the resonant blade system (Figure 4). Usually designed for a single thruster, this model is developed to measure the impulse bits and thrust of pulsed plasma thruster (Bijster, 2014). The thruster is mounted on a blade with an eigenfrequency at the thruster activation frequency. It results in a forced vibration of the resonant blade that amplifies the motion that the blade would have after a single pulse. The resonant operation reduces the effect of environmental vibrations. This principle is also used for torsion balance operation. This type of thrust stand is relatively low cost, but has to be redesigned for every thruster.
This paper outlines a methodology for developing a test bench for precise measurement of thrust between 0.1 and 1.0mN and impulse bits between 0.01 and 1mNs for MEMS based micro-thrusters. The goal was to recommend a system for the design, calibration and operation of the test bench best suited for the desired outcomes by doing an extensive literature review, and then develop a theoretical model, and verify the response of the system. This theoretical model can then be used for the development of an actual test bench. Hanging pendulum torsion system is the most commonly used configuration and is used in this methodology because of its high sensitivity, versatility and stability. Laser displacement sensor is chosen for this design for its high resolution, sensitivity and low commercial cost. The sensor parameters are taken from a commercially available sensor. The parameters used for validation of the dynamic model have been taken from other existing benches to ensure the applicability of the design. The dynamics of the system are finally validated by simulating the system using MATLAB Simulink.
The dynamic modeling and the design methodology can be used for designing any hanging pendulum test bench. It has also been adopted by the Institute of Space Technology, Islamabad, Pakistan, for development of a test bench. The test bench can be employed for very precise thrust and impulse measurement of micro-scale thrusters of satellites.
Mathematical Modeling

Figure 5. Undamped, unforced simple pendulum system.
A hanging pendulum system using a torsion spring is developed and its design parameters are specified. The dynamics for a hanging and undamped, unforced simple pendulum (Figure 5) are used to formulate the expressions for thrust and impulse measurement.
For a forced system with a forcing function F(t), damping constant c and a torsional spring with stiffness k, the following expression can be used. The response of the system is very small, so we can safely assume that sinθ ~θ.
mx + cx + kx + mgθ = F(t)l (Equation 1)
And for the torque system, the system equation can be expressed as
Iθ + cθ + k_(θ)θ = F(t)l (Equation 2)
where the angular spring constant k_θ =k_(θspring) + mgl and damping c = 2ςω_(n)I. This equation can be expressed in the standard form as (see PDF) where the damping ratio ς and the natural frequency ω_n are given by (see PDF).
Mathematical Model for Thrust
For thrust model, the driving function is constant with time, that is, it provides a constant thrust for measurement. (See PDF).
Solving for an underdamped spring 0 < ς < 1, the solution of the system becomes (see PDF). Since the response before thrust application is zero, the initial conditions are θ(t) = 0 and (dθ(t))/(dt) when t = 0. Using these conditions and solving the differential equation, we get (see PDF). Solving for thrust when t→∞, (see PDF). The time required for the system to stabilize (setting time) is given by the following equation, where a is percentage tolerance of the final value, (see PDF).
Mathematical Model for Impulse
For impulsive function, the force function is applied with a specific magnitude for infinitesimally small period of time. For an impulse function at (see PDF). Solving using the general equation of the system, (see PDF). At ϵ→0+, where 0+ is the limiting value of time approaching from the positive side, (see PDF). The impulse function acts only so as to change the rate of displacement. From the initial conditions for the impulse system (see PDF) and θ(0^+) = 0, the expression for impulse bit can be written as (see PDF) where (see PDF) is the damped frequency. At t = T/4, which is the first peak (amplitude) of the mass vibration, sin(ω_(d)t) = 1 and θ(t) = θ_max. Therefore, (see PDF).
System Properties
Natural Frequency
If the force on the thrust stand is time-varying, the response also varies with time and the amplitude depends on the frequency of applied force rather than on the natural frequency of the stand. So, the thrust stand sensitivity can vary with frequency for dynamic thrust loads. However, in the case of thrust, a constant force is applied while measuring thrust. Therefore, there is no effect of natural frequency of system on thrust measurement. In the case of impulse, there is a driving frequency. The stand should be designed to be under-damped with a damping ratio of 0.5 - 0.6 and a natural frequency much higher than the input frequencies in order to achieve a flat response for relevant thrust input frequencies. High natural frequencies can be achieved with high stiffness or low moment of inertia. Of these strategies, decreasing moment of inertia is preferred; otherwise, sensitivity (which scales inversely with stiffness) will be sacrificed for flat response. Once the system has been designed, moment of inertia will be constant for a particular thruster; its natural frequency is fixed. The propellant tanks, in this case, are mounted on a stationary stand rather than on the pendulum. Therefore, the moment of inertia and consequently the natural frequency will be constant for a particular experiment.
Counter Mass
Incorporation of a counter mass in the system is analyzed. Counter mass increases the deflection produced for a given thrust (Figure 6). This is mathematically modeled.
Retarding force and damping act in the same way for both masses, that is, to damp the motion. By adding counter mass, the spring stiffness is changed,

Figure 6. Figure 6. Counter-mass increases the deflection produced for a given thrust on pendulum.
k_θ = ((ml - mclc)gθ + k_θspring) (Equation 13)
As k_θ becomes smaller, deflection increases for the constant thrust. In the case of impulse, ω_d decreases and I increases, but the absolute change in I is less than the absolute change in ω_d. Therefore, deflection for impulsive load increases as well.
Damping
The time required to reach the steady state deflection depends on the damping coefficient. The settling time, defined as the time required to settle within specified error band of the steady state deflection, depends on the damping coefficient for over-damped and under-damped (which is our case) pendulums. So, sufficient damping is required in test bench in order to reduce time to reach steady state for θ(∞) ~ θ(t=∞).
The expression for impulse also shows that it is dependent upon damping. The peak amplitude θ_max also decreases as the damping coefficient increases and vice versa. Moreover, if damping is not sufficient, it will not suppress environmental noise which may lead to error.
Noise
The targeted resolution of the thrust stand is subjected to external and internal noise sources. The external sources include any external mechanical disturbance transmitted to the force balance by seismic or pressure disturbances. Clinton and Heaton (2002) suggested that the earth surface has a seismic background noise in the 0.01–10Hz range, rendering any sensitive pendulum susceptible to seismic noise in this spectral range. Internal sources primarily include electrical noise. The noise in the designed thrust stand can mask the results, causing inaccuracy in the required measurement. The extraction of the results from this error is to be done for the precise thrust and impulse measurement. For that, the suggested way is to use a low pass filter to cut off any high frequency values from the obtained data.
A few lowpass filters were studied, but Butterworth low pass and Savitzky-Golay filters were found to be the most promising for the noise cancellation. However, there is uncertainty in the results because the transient part differs for the different filters (Janssens, 2009). The result and functionality of these filters can be observed using Simulink where these can be assigned different values for low pass and certain exemplary values of the bench are given as input to get the tested result. The actual value of low pass filtration can be obtained via experimental results. For that, the thrust stand is operated without any engine and the values obtained in this run are the source to eliminate the noise from the raw data.
Laser Sensor

Figure 7. Configuration using optical sensor.
Laser measurement sensor was chosen based on its accuracy and its measurement range. The size, cost and resolution of laser sensors of micro-scale work well with the design conditions. Based on most commonly available micro-scale sensors commercially, a sensor with resolution of 0.03µm and measurement range of 0.03 - 1mm was chosen. The laser sensor is placed at a distance of 0.45m from the pivot (Figure 7) and it measures the linear displacement covered, which can be used to determine the tilt (angle) of the rod.
Design Calculations and Component Specification

Table 1. Properties from (Bijster, 2014) used as design parameters.
Table 1 shows the design parameters obtained from (Bijster, 2014).The test bench was designed and a physical model for the bench (Figure 8) was prepared on the basis of which the bench characteristics were defined and calculated. The length of the pendulum depends upon the limit imposed by the height of the vacuum chamber. The vacuum chamber is about 2m in height. For our purpose, we choose 0.5m as the length of the pendulum.

Figure 8. 3-D assembly model of the designed system.
Assuming mass of engine = 200g, the same arm weight as used by Bijster (2014) and counter mass = 0kg, the moment of inertia of the pendulum system comes out to be 0.059725kgm^2. Using linear method, our sensor has a measuring range for maximum single side swing of 1mm and a minimum value of 0.03mm. The angular limits of the sensor imposed on the design are thus 6.7×10⁻⁵ -220 × 10-5 rad.
The angular spring constant k_θ of (Bijster, 2014) was 0.64Nm/rad, which is used for our design as well. The value of k_θ can also be optimized by varying the value of total arm length or position of the sensor. The maximum and minimum possible thrusts that can be measured come out to be F_max=2.8mN and F_min=0.085mN, respectively. This result is better than the required design conditions for thrust.
Counter mass is used to maintain constant value of I for different thruster masses. It can also be used to vary the measurement range of the bench. By using Heaviside function (Zandbergen et al., 2010), for accuracy = 99%, t ≈ 4min. Hence, after four minutes, an accuracy of 99% can be achieved for thrust calculation.
According to natural frequency formula, as I changes, k_θ also changes so that ω_n has different values. By using the calculated test bench constraints, the calculated ω_n=3.2735rad/s. Damping ratio is usually estimated from logarithmic decrement function. However, as we do not have a physical model, we cannot use this approach. For design calculations, damping values from Bijster (2014) were used. The limits calculated for impulse bits using these design conditions are.
The impulse limits are not falling within our design conditions. The limits can be achieved by changing the limits of the sensors. However, this results in decrease in resolution. Counter mass is an effective method of controlling k_θ and making it fall within the desired limits. That is why it is incorporated into our system. To get the test bench within the required limits, I can be varied by designing the pendulum and later by adding or removing counter mass. This varies the moment of inertia needed for different readings. Table 2 shows the calculated characteristics.
Design Simulations
In order to test the validity of the design, MATLAB Simulink was used. The results (Table 2) were validated and the calculated response of the system was verified.
The following governing equations were used for verification via Simulink: (see PDF).
Thrust Simulation
For thrust calculations, F(t) is taken as a constant after the thrust has been applied. The model of the equation is shown in Figure 9. The data was calculated manually before using in these simulations.

Figure 9. Layout of thrust simulation in Simulink.
Impulse Simulation
Impulse calculation is based on the same governing equation, except for the fact that F(t) is an instantaneous force instead of a constant one as was the case in thrust simulation. Time period of the impulsive force can be varied and was taken at 0.001s. Impulse model is shown in Figure 11.
As in the case of thrust, the data used was from manual calculations and the response of the system was calculated at minimum and maximum limits.
RESULTS
Thrust
The simulation is for the maximum possible thrust of 2.8mN. According to our calculation, the deflection should be 0.0022rad, the limit set for our sensors. The results are shown in Figure 10. The yellow line signifies the applied thrust.
The time for oscillations to be damped to get a result with an accuracy which is greater than 99% was calculated to be a little less than four minutes. On analyzing the graph after 240s, it is evident that an accuracy of more than 99% is achieved in the readings (Figure 10).
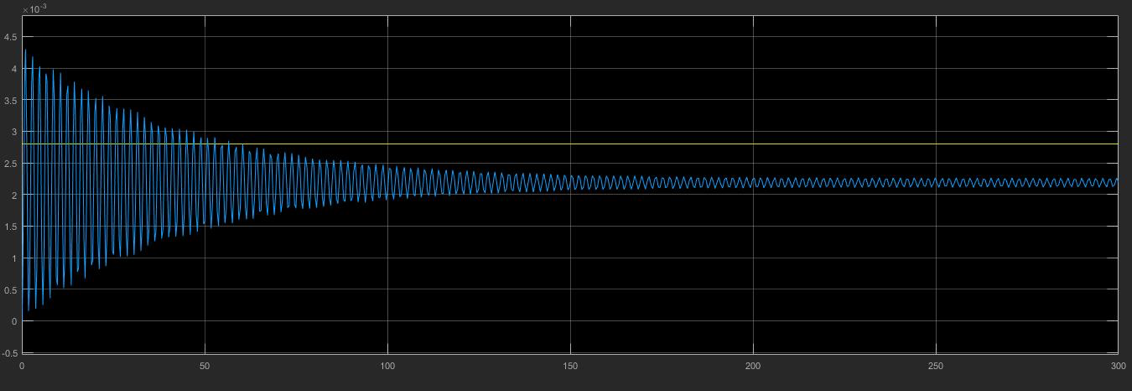
Figure 10. System response to thrust. x-axis: time (s), y-axis: deflection (rad, blue) and thrust (N, yellow).

Figure 11. Layout of impulse simulation in Simulink.
Impulse
The maximum limit results are shown in Figure 12. For an impulse of 0.869mNs, the maximum amplitude of the bench should be 0.0022rad to fall within the measuring range of the sensor. For impulse calculation, the value of the first peak (maximum) is used, which is exactly the result calculated manually.
DISCUSSION

Table 2. Characteristics of the designed thrust and impulse test bench.
This paper presents the development of a test bench to measure thrust between 0.1mN and 1.0mN and impulse bits between 0.01mNs and 1mNs for MEMS-based micro-thrusters. Both thrust and impulse dynamics were simulated to show the resultsx obtained through manual calculations (Table 2) to be accurate. The simulated results (Figures 10 and 12) correlate well with the design calculations. The designed system fulfills the required criteria of thrust and impulse measurements. The measuring limits of the designed bench are 0.085mN to 2.8mN for thrust and 0.0265mNs to 0.869mNs for impulse using no counter weight. The limits for the thrust exceed the design requirements whereas the limits for impulse bits fall short of the design requirements. The limits can easily be adjusted using counter mass to achieve the desired values. This equation model can be used to predict results for a test bench and for analyzing the results obtained through an actual bench.

Figure 12. System response to impulse. x-axis: time (s), y-axis: deflection (rad, blue)
The design of this test bench has been validated for the calculated results using Simulink. However, it is still open for verification by an actual model. Discrepancies between physical and theoretical models can be accommodated and minimized using the techniques specified. In an actual test bench, the noise from background vibrations can cause significant error, especially in measurement of very small thrust and impulse. This error can be reduced using low pass filters.
The dynamic modeling and the design methodology can be used to design any hanging pendulum test bench and has been adopted by the Institute of Space Technology, Pakistan, for test bench designs.
ACKNOWLEDGMENTS
This work has been supported by University of Engineering and Technology, Lahore, and Institute of Space Technology, Islamabad. We are very grateful to our respected project advisor, Muhammad Zubair Sheikh. His skills, wisdom and experience guided us throughout this project.
REFERENCES
Bijster, R. J. F. (2014). Design, Verification and Validation of a Micropropulsion Thrust Stand (Doctoral dissertation), Delft University of Technology, Delft, Netherlands.
Clinton, J. F., & Heaton, T. H. (2002). Potential advantages of a strong-motion velocity meter over a strong-motion accelerometer. Seismological Research Letters, 73(3), 332-342. doi:10.1785/gssrl.73.3.332.
Emhoff, J. W., Simon, D. H., & Land, H. B. (2007). Progress in thrust measurements from micro pulsed plasma discharges. Paper presented at 43rd AIAA/ASME/SAE/ASEE Joint Propulsion Conference & Exhibit: Cincinnati, OH. Reston, VA: American Institute of Aeronautics and Astronautics. Retrieved from Aerospace Research Central. doi:10.2514/6.2007-5299
Janssens, S. M. J. (2009). Design of a micro propulsion test bench. Delft University of Technology, Delft, The Netherlands.
Jean-Yves (2006). Test bench for pop-pop engines. [Web log post]. Retrieved August 11, 2017, from http://www.eclecticspace.net/poppop/jy/Test_bench_for_pop-pop_engines_V3.1.pdf
Khayms, V. (2000). Advanced propulsion for microsatellites (Doctoral dissertation). Massachusetts Institute of Technology, Cambridge, Massachusetts, USA.
Lamprou, D., Lappas, V. J., Shimizu, T., Gibbon, D., & Perren, M. (2011). Hollow cathode thruster design and development for small satellites. Paper presented at 32nd International Electric Propulsion Conference: IEPEC-2011, Wiesbaden, Germany.
Luna, J. P., Edwards, C. H., Del Amo, J. G., & Hughes, B. (2011). Development status of the ESA micro-Newton thrust balance. Paper presented at 32nd International Electric Propulsion Conference: IEPEC-2011, Wiesbaden, Germany.
Mueller, J., Hofer, R., & Ziemer, J. (2010). Survey of propulsion technologies applicable to cubesats. Retrieved August 11, 2017, from https://ntrs.nasa.gov/search.jsp?R=20100032899.
Packan, D., Bonnet, J., & Rocca, S. (2007, September). Thrust measurements with the oneramicronewton balance. Paper presented at 30th International Electric Propulsion Conference: IEPC-2007, Florence, Italy.
Pancotti, A. P., Lilly, T., Ketsdever, A., Aguero, V., & Schwoebel, P. (2005, July). Development of a thrust stand micro-balance to assess micropropulsion performance. Paper presented at 41st AIAA/ASME/SAE/ASEE Joint Propulsion Conference & Exhibit: Tucson, AZ. Reston, VA: American Institute of Aeronautics and Astronautics. Retrieved from Aerospace Research Central. doi:10.2514/6.2005-4415
Polk, J. E., Pancotti, A., Haag, T., King, S., Walker, M., Blakely, J., & Ziemer, J. (2013). Recommended practices in thrustmeasurements. Paper presented at 33rd International Electric Propulsion Conference: IEPEC-2013, Washington, DC.
Soni, J., Zito, J. C., & Roy, S. (2013). Design of a microNewton thrust stand for low pressure characterization of DBD actuators. Paper presented at 51st AIAA Aerospace Sciences Meeting: Grapevine, TX. Reston, VA: American Institute of Aeronautics and Astronautics. Retrieved from Aerospace Research Central. doi:10.2514/6.2013-755.
Spence, D., Ehrbar, E., Rosenblad, N., Demmons, N., Roy, T., Hoffman, S., ... Tocci, C. (2013). Electrospray propulsion systems for small satellites. Paper presented atAIAA SPACE 2013 Conference and Exposition: San Diego, CA. Reston, VA: American Institute of Aeronautics and Astronautics. Retrieved from Aerospace Research Central. doi:10.2514/6.2013-5329
Sutherland, O., Appolloni, M., O’Neil, S., Gonzalez del Amo, J., & Hughes, B. (2008). Advances with the ESA Propulsion Laboratory µN Thrust Balance. Paper presented at 5th International Spacecraft Propulsion Conference, Crete, Greece.
Wilson, M. J., Bushman, S. S., & Burton, R. L. (1997). A compact thrust stand for pulsed plasma thrusters. IEPC-97-122.
Xu, K. G., & Walker, M. L. (2009). High-power, null-type, inverted pendulum thrust stand. Review of Scientific Instruments, 80(5). doi:10.1063/1.3125626.
Yang, Y. X., Tu, L. C., Yang, S. Q., & Luo, J. (2012). A torsion balance for impulse and thrust measurements of micro-Newton thrusters. Review of Scientific Instruments, 83(1). doi:10.1063/1.3675576
Zandbergen, B. T. C., Janssens, S., Valente, F., Perez-Grande, D., & Koopmans, R. (2010). Test facility development for testing of micro-thrusters at TU-Delft. Paper presented in 6th International Spacecraft Propulsion Conference: San Sebastian, Spain.