
Authors: Joseph A. Hammerstrom, Pierre-Richard J. Cornely
Institution: Eastern Nazarene College Physics and Engineering Department 23 East Elm Avenue
doi:10.22186/jyi.31.4.13-16
ABSTRACT
Earthquakes are extremely dangerous physical phenomena. The ability to properly forecast them would go a long way in reducing the damage they cause. One earthquake forecasting method being researched uses the ionospheric Total Electron Content (TEC). Our investigation used TEC data from 2011 during certain days near and on the date of the earthquake off the coast of Tōhoku, Japan. We took advantage of the large amounts of GPS records obtained by the GPS Earth Observation Network (GEONET) of Japan which contained the TEC data needed. This data was used to visualize the TEC over the course of the day of the Tōhoku earthquake. The video produced abnormalities consistent with the predicted effect an earthquake has on the ionosphere. These abnormalities were shown to not be caused by solar and geomagnetic activity. These results suggest that detectable ionospheric activity precedes earthquakes. Ionospheric disturbances are also known to be caused by other confounding factors such as solar and geomagnetic activity. Careful analysis is included in this paper to exclude this class of disturbances from those that are seen to occur due to seismic and pre-earthquake activities. The hope is that the potential correlation between seismic and pre-earthquake activities may be used as an earthquake precursor towards the development of an earthquake forecasting method.
INTRODUCTION
Recently, research has focused on the relationship between the state of the ionosphere and seismic activity (Heki & Ping, 2005; Oyama, Kakinami, Liu, Abdu, & Cheng, 2011). One ionospheric parameter that has been investigated is the Total Electron Content (TEC). TEC is defined as the number of electrons along a path between a receiver (rx) on the surface of the earth and a GPS satellite (st) in orbit. The TEC can be computed with the line integral from a GPS satellite and a receiver as described in (1).

(1)
Where:
r = is range or radial position (meters)
Θ = latitude (degrees)
Φ = longitude (degrees)
t = time (seconds)
With regards to the correlations between TEC and pre-earthquake and seismic activities, the TEC is an important parameter of study because it has the potential for showing the changes in the ionosphere due to these activities. It is because seismic and pre-earthquake activities create stress in rocks in the earth’s crust. These stresses are known to positively charge the rocks on the earth’s crust. As the positive charges accumulate at the rocks outer surfaces, they create a difference in potential which in turn creates a flow of charges that can travel fast and far from their point of origin. As the charges travel upward under the influence of the electric field lines between the surface of earth and the bottom of the ionosphere, they reach the bottom of the ionosphere, disturbing the equilibrium of the electrons in the ionosphere (Freund, Takeuchi & Lau, 2006). These disturbances can be seen in the TEC which makes TEC a potential candidate as an earthquake precursor. If TEC disturbances could be used as an earthquake precursor, tracking those disturbances could be used as part of an earthquake forecasting system which would improve earthquake warning systems, in turn saving countless lives.
This study uses TEC data from Japan and current knowledge of the Tōhoku Japan earthquake to determine whether pre-earthquake and seismic activities correlate with TEC changes around the time of the earthquake.
METHODS
TEC disturbances can be observed using GPS signals. It is because the ionosphere creates a phase delay in the electromagnetic signals, sent from a receiver on earth to a GPS satellite in orbit. The phase delays change based on several variables: the frequency of the emitted signals, the path from the receiver to the satellite and the associated electron density along the path. The phase delay can be used to estimate the distance (called pseudo-range) from the GPS satellite and the receiver. More specifically, since the ionosphere is a dispersive medium (i.e., varies with frequency), using two signals with known GPS frequencies, we can measure the phase delay between the returned signals to estimate the TEC as shown in (2).

(2)
Where:
Prs= The differential pseudo-range measurements
f1,f2 = The GPS measurement frequencies: 1,575.42 and 1,227.60 MHz
TEC = The Total Electron Content (m/s2)
DCB = The biases in the measurements
From these measurements, we can test if seismic activity causes detectable disturbances in the ionosphere’s TEC.
The visualization of TEC data over Japan required GPS readings from the GPS Earth Observation Network (GEONET) of Japan (http://datahouse1.gsi.go.jp/terras/terras_english.html). From these readings, TEC values were obtained using the relationship in (2), resulting in multiple data points for each receiver over time. The GPS data was contained in receiver independent exchange format (RINEX) observation data files. These files contain phase delay measurements for GPS signals, as well as the time at which these measurements were made. These files were processed to extract TEC data over time, which was done using a FORTRAN program. The FORTRAN program was originally developed by Professor Kosuke Heki of Hokkaido University in Japan. The TEC data over time was then input into MATLAB (The Mathworks Inc., Natick, MA, 2013) for analysis and visualization. We averaged the data points at each site and time, resulting in one data point for each site every 30 seconds (the sampling period of the GPS receivers). This data was interpolated using a linear triangulation method, resulting in one grid of interpolated data over Japan every 30 seconds. We turned these grids into contour plots, each plot creating a frame for the video file produced.
Since disturbances in the ionosphere are not necessarily caused by seismic activity, we considered other possible sources of disturbances in our analysis. We obtained measurements of 10.7 cm solar flux (F10.7), the sunspot number (SSN), and earth’s geomagnetic storm activity (Kp index) over the month of March in 2011. This data was provided by the National Oceanic and Atmospheric Administration’s Space Physics Interactive Data Resource (SPIDR) (http://spidr.ionosonde.net/spidr/). This data was compared to other research (Hasbi et al., 2009) (Ouzounov et al., 2011) to determine whether any ionospheric irregularities could have been caused by solar or geomagnetic sources.
RESULTS
The video of TEC levels produced for February 11th and March 11th show the behavior of the ionosphere throughout the day. From the video on March 11th, after an initial enhancement (Figure 1A), a sudden depletion of roughly 30 TECU in 15 minutes was observed from 1:35 PM JST to 1:50 PM JST (Figure 1B). Large fluctuations were also observed, with a significant example from 4:25 PM JST (Figure 1C) to 5:00 PM JST (Figure 1D) showing levels decreasing by 50 TECU in 45 minutes. For comparison, plots from February 11th (one month before the earthquake) were taken at the same times (Figure 2). Data from the same times of day show no enhancements, depletions, or fluctuations.
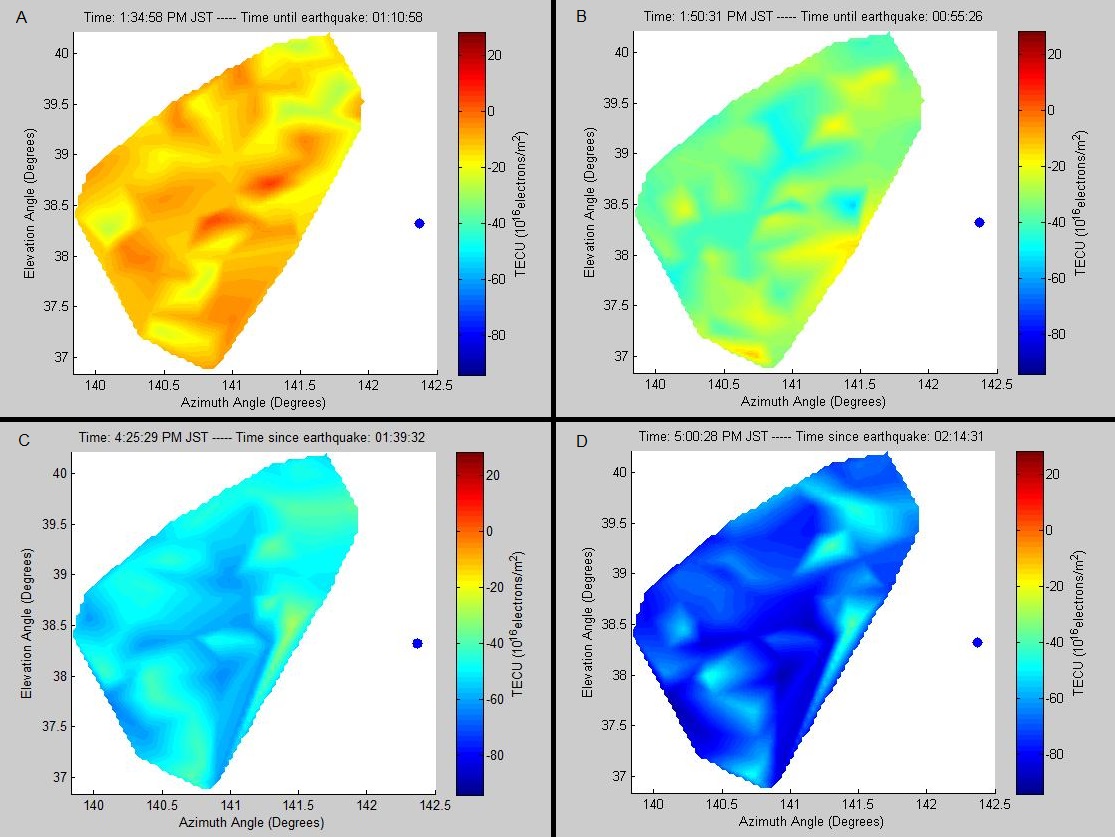
Figure 1. Images of heat maps of TEC over the 100 closest receivers to the epicenter of the earthquake on the day of the earthquake (March 11, 2011) for four different time points. These times show enhanced TEC (A), a sudden depletion (B), and the large fluctuations following (C and D) The X- and Y-axes represents the longitude and latitude, respectively.
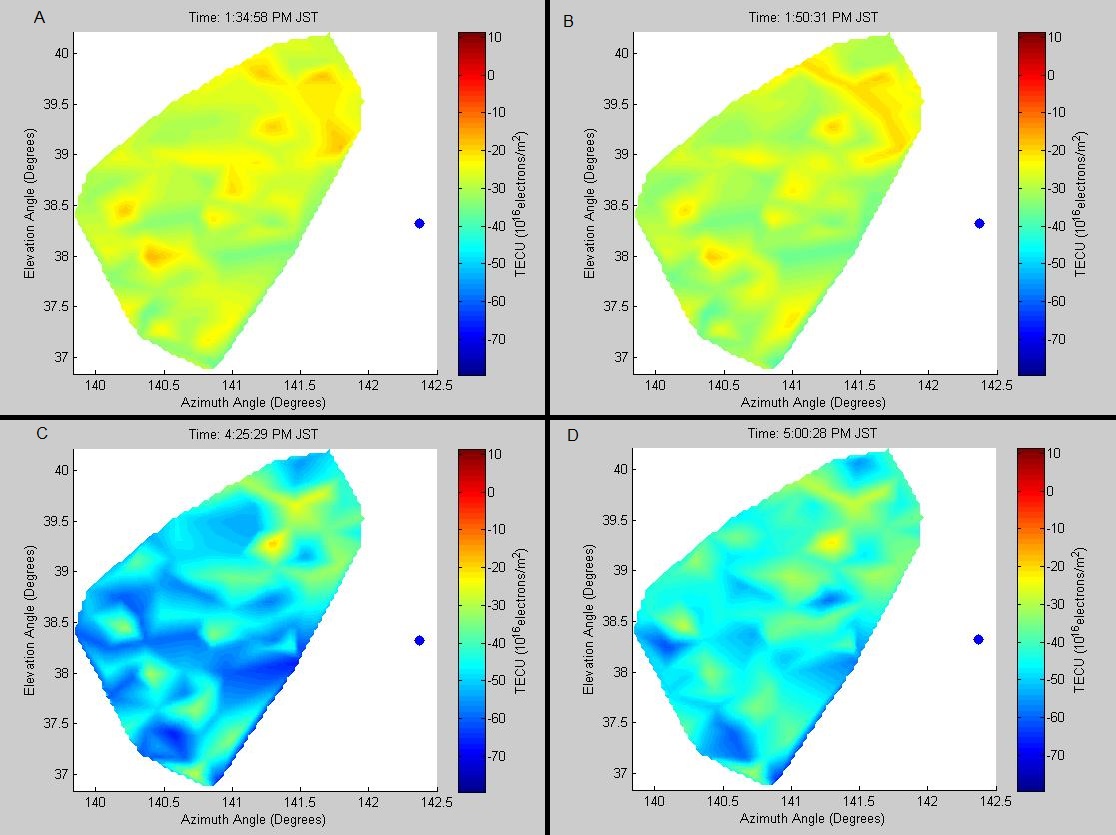
Figure 2. Images of simulations of TEC over the 100 closest receivers to the epicenter of the earthquake a month before the earthquake (February 11, 2011) for four different time points. These points are from the same times of day as the enhancement (A), depletion (B), and fluctuations (C and D). The X- and Y-axes represents the longitude and latitude, respectively.
Sunspot number data for March 2011 shows a sunspot count of roughly 100 on March 8, coming down to 60 on March 11th (Figure 3A). Geomagnetic storm activity data for March 2011 shows a Kp of roughly 5.3 on March 11th, with relatively low numbers before March 11th (Figure 3B). Solar flux (F10.7) data for March 2011 shows heavy activity on March 7th with measurements of more than 900 watt per square meter-hertz, with relatively calm activity for the rest of the month (Figure 3C).
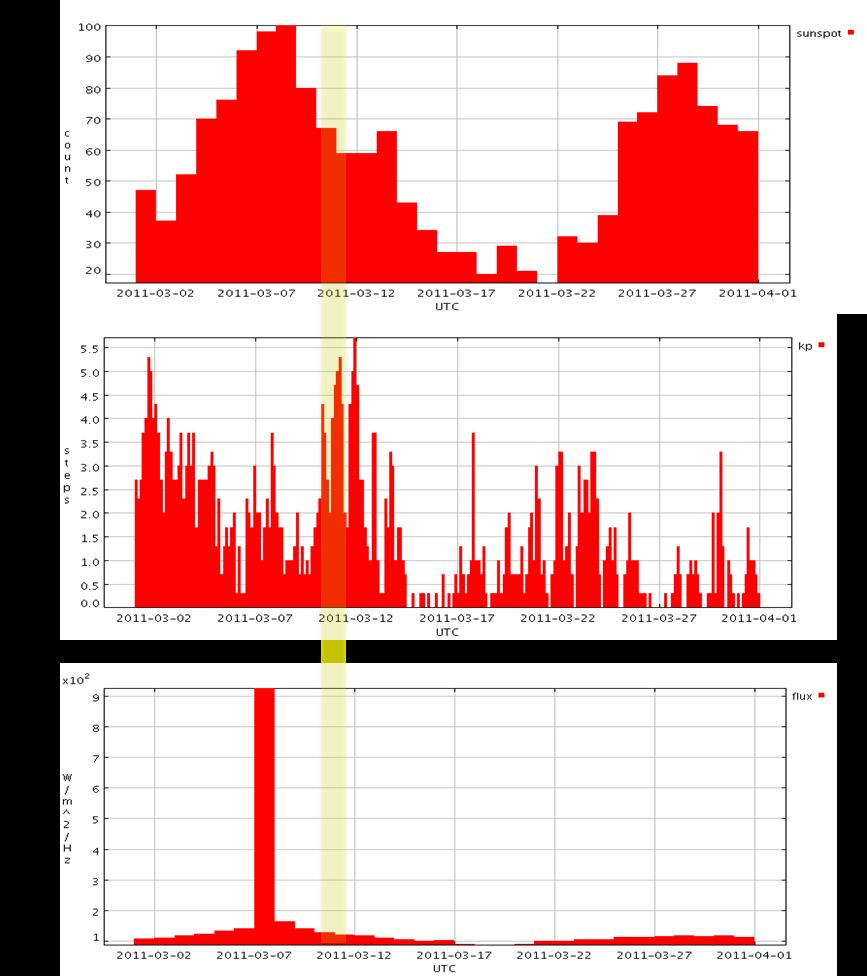
Figure 3. Histograms of potential confounding parameters of TEC. A) Sunspot, B) 10.7 cm solar flux and C) kp, analyzed over a one-month period (March 2 – April 1, 2011) around the earthquake. Yellow highlight indicates the day of the earthquake.
Discussion
It has been proposed that TEC anomalies can be caused by seismic activity. Our study looked at GPS data during the 2011 Tōhoku Earthquake to investigate the correlation between TEC and seismic activity. The investigation resulted in evidence supporting detectable TEC disturbances caused by pre-seismic activity.
TEC measurements taken over the course of the earthquake showed significant TEC anomalies during seismic activity compared to a time period with no seismic activity. The TEC on the day of the earthquake shows an initial enhancement, followed by a rapid depletion and large fluctuations. Comparatively, TEC levels on a day with no seismic activity behave smoothly.
While these results provide strong evidence indicative of seismic activity causing TEC disturbances, it is necessary to make sure no other source caused these enhancements, depletions, and fluctuations. While the values are relatively high for the sunspot number (SSN) and magnetic storm activity (Kp) (Figure 3A-B) compared to expected levels, prior work has shown these values alone are not significant to cause a disturbance of this magnitude in the ionosphere (Hasbi et al., 2009). The solar flux peaked for the time frame analyzed on March 7th, four days before the earthquake (Figure 3C). Based on previous studies, the solar flux around the day of the earthquake is likely not the cause of the TEC disturbances on the day of the earthquake due to the timing of the maximum flux (Ouzounov et al., 2011).
This study had limitations with certain systemic sources of error in the measurements of TEC, as reflected in the DCB term shown in (2). The data analyzed did not take into account the angle through which the GPS signals passed through the ionosphere. This leads to the GPS signals passing through a larger section of the ionosphere when the satellite is not directly above the receiver. Another source of error that should be considered is certain biases introduced from the GPS satellites and receivers, as well as the troposphere. These biases are introduced due to many factors, such as satellite ephemeris inaccuracies, clock errors, as well as atmospheric conditions and measuring equipment temperature. These errors were out of the scope of this study, and should be looked into further.
It is highly probable that the earthquake caused the enhancements, depletions, and fluctuations in the TEC. However, more detailed work is needed to help determine the exact cause and nature of TEC events surrounding seismic activity. Future investigations should focus on tracking and monitoring TEC for longer periods of time surrounding an earthquake to better characterize the beginning and length of disturbances. In addition, further research should be performed to determine how solar flux, magnetic storms, or other external events affect TEC disturbances.
CONCLUSION
The pattern of TEC enhancements, depletions, and fluctuations expected by previous works (Heki & Ping, 2005) were noticed in TEC measurements near the time of the earthquake. These TEC behaviors are quite different from the average expected behaviors resulting from a smooth ionosphere. These TEC behaviors are also seen not to result from or be correlated with other outside phenomena such as solar flux and geomagnetic storms. Our results support the hypothesis that seismic activity increases disturbances in TEC. Future research should focus on developing methods to isolate the effects of seismic activities from confounding factors and to remove errors from TEC measurements.
REFERENCES
Freund, F. T., Takeuchi, A., & Lau, B. W. (2006). Electric currents streaming out of stressed igneous rocks – A step towards understanding pre-earthquake low frequency EM emissions. Physics and Chemistry of the Earth, 31(4-9), 389-396. doi:10.1016/j.pce.2006.02.027
Garner, T., Gaussiran II, T., B.W., T., R.B., H., Calfas, R., & Gallagher, H. (2008). Total electron content measurements in ionospheric physics. Advances in Space Research, 42, 720-726. doi:10.1016/j.asr.2008.02.025
Hasbi, A. M., Momani, M. A., Mohd Ali, M. A., Misran, N., Shiokawa, K., Otsuka, Y., & Yumoto, K. (2009). Ionospheric and geomagnetic disturbances during the 2005 Sumatran earthquakes. Journal of Atmospheric and Solar-Terrestrial Physics, 71(17-18), 1992-2005. doi:10.1016/j.jastp.2009.09.004
Heki, K., & Ping, J. (2005). Directivity and apparent velocity of the coseismic ionospheric disturbances observed with a dense GPS array. Earth and Planetary Science Letters, 236, 845-855. doi:10.1016/j.epsl.2005.06.010
Ouzounov, D., Pulinets, S., Romanov, A., Romanov, A., Tsybulya, K., Davidenko, D., . . . Taylor, P. (2011). Atmosphere-Ionosphere Response to the M9 Tohoku Earthquake Revealed by Joined Satellite and Ground Observations. Preliminary results. Earthquake Science, 24(6), 557-564. doi:10.1007/s11589-011-0817-z
Oyama, K., Kakinami, Y., Liu, J. Y., Abdu, M. A., & Cheng, C. Z. (2011). Latitudinal distribution of anomalous ion density as a precursor of a large earthquake. Journal of Geophysical Research, 116(A4). doi:10.1029/2010JA015948