
Author: Michael Lai
Institution: Department of Pathology, Stonybrook University, 101 Nicolls Rd, Stony Brook, NY 11794
doi:10.22186/jyi.31.5.17-24
ABSTRACT
The Epithelial Mesenchymal Transition (EMT) has been implicated as a driving force behind the metastasis of epithelial derived cancers; it stimulates the acquisition of a migratory, drug resistant mesenchymal phenotype. Current proposals for targeting EMT-facilitated metastasis are ineffective, as a majority focus on the inhibition of EMT-initiating signals. Instead, this study used a novel approach aimed at directly inhibiting the mesenchymal phenotype by targeting mesenchymal survival pathways post mapping at specifically up-regulated points in the mesenchymal state. In vitro EMT models of three lung adenocarcinoma cell lines (A549, HCC827, HCC4006) were each treated with three concentrations (50nM, 0.5µM, and 5µM) of AZD1480, BAY87-2243, MK-2206, and GDC0994 at 48 hours, which targeted the JAK/STAT, PI3K-AKT, and MAPK pathways, respectively. MTT assays were used to quantify cell death and determine cell viability. Across all assays, the JAK 1/2 inhibitor AZD1480 resulted in the greatest elimination of EMT-xderived mesenchymal cells. 5µM AZD1480 significantly reduced cell viability in mesenchymal populations treated with AZD1480, supporting JAK1/2 as a potential therapeutic target in lung cancer. Future investigations include testing AZD1480’s effectiveness in decreasing cell viability among alternative epithelial-derived cell lines in vitro and its effectiveness as a suppressor of metastasis in vivo.
INTRODUCTION
Lung cancer is currently the most prevalent form of cancer in the United States, causing over 158,000 deaths each year (American Lung Association, 2016). More than 90% of these deaths and other cancer-associated mortality can be attributed to metastasis (Ray & Jablons, 2009). An immense clinical need exists for novel treatments either targeting or preventing metastasis, especially in early stage cancer patients.
In order for distant metastasis to occur, primary tumor cells must disseminate through the blood vessels and invade a distant organ site (Brabletz, 2012). A biological phenomenon known as the Epithelial-Mesenchymal Transition (EMT) is a key facilitator of this process. EMT involves a series of changes which allow a cancer cell to transition from a stationary epithelial phenotype to a migratory, drug resistant mesenchymal phenotype. This process includes the disassembly of epithelial cell-junctions and a loss of epithelial polarity in exchange for mesenchymal characteristics, such as a fibroblast-like morphology and increased invasiveness (Thomson et al., 2010). A full EMT, defined as a complete transition from epithelial cell surface markers, such as E-cadherin and Occludin, to mesenchymal markers, such as Vimentin and N-cadherin, often requires ten days or more (Cao, Xu, Liu, Wan, & Lai, 2015; Rai & Ahmed, 2014).
EMT-Mediated Metastasis
After EMT has transpired, the newly formed mesenchymal cells enter the bloodstream through the process of intravasation (invasion of cancer cells through the basement membrane) and disseminate throughout the body, eventually invading a distant organ site, through the process of extravasation (cancer cells exit the capillaries and invade an organ; Fig 1). At this distant organ site, the cancer cells undergo a Mesenchymal-Epithelial Transition (MET), the reverse process of EMT, in order to colonize and form a secondary epithelial tumor. By reverting to their original epithelial phenotype, the cells regain the ability to proliferate rapidly and form cell-cell junctions, two characteristics that are necessary for successful colonization. These characteristics were lost during the original EMT, when the cells acquired the ability to metastasize (Kalluri & Weinberg, 2009). After MET has occurred and a second epithelial tumor is established, the process of metastasis is complete. Thus, EMT is considered an important process during the early stages of metastasis, while MET is considered an important process during the later stages of metastasis (Brabletz, 2012).
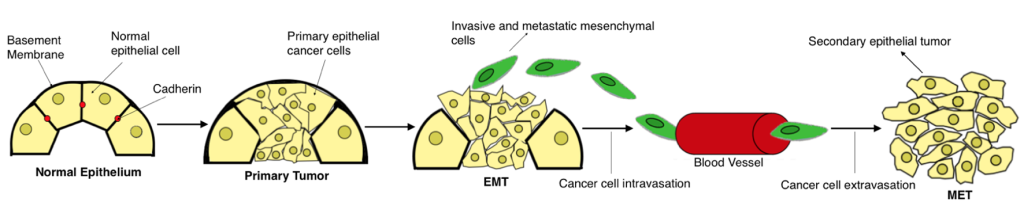
Figure 1. EMT as a facilitator of the metastatic process. The progression from normal epithelium to invasive carcinoma occurs through several phases. As tumorigenesis transpires, epithelial cells rapidly begin to proliferate, forming a primary carcinoma in situ, which consists of epithelial cancer cells. As EMT occurs, these epithelial cancer cells shed their cell polarity and detach from the basement membrane, while transitioning into an invasive/migratory mesenchymal phenotype. EMT is complete upon the degradation of the basement membrane. Once EMT is complete, the mesenchymal cells migrate away from the primary tumor body and into the blood stream, allowing them to disseminate throughout the body and invade distant organ sites. Upon reaching a secondary site, the mesenchymal cells undergo MET, the reverse process of EMT, and revert to their original epithelial phenotype. Consequently, metastasis ensues and a second epithelial tumor is established (created by student researcher; adapted from Kalluri & Weinberg, 2009).
EMT induction primarily occurs through the activation of phosphorylation cascades by various cytokines and growth factors present within the tumor microenvironment, including Transforming Growth Factor Beta (TGFß), Hepatocyte Growth Factor (HGF), Epidermal Growth Factor (EGF), and Platelet Derived Growth Factor (PDGF), among others. As the cascades are activated, the expression of E-cadherin, an important cell-adhesion molecule which maintains the epithelial state, is repressed, and EMT ensues (Cao, Xu, Liu, Wan, & Lai, 2015). This repression is facilitated by the transcriptional activity of four EMT-initiating transcription factors: Snail, Slug, Zeb, and Twist. Snail, Slug, and Zeb repress E-cadherin through direct binding to the promoter region of CDH1, the gene which codes for E-cadherin. Twist, on the other hand, functions in a different mechanism and represses E-cadherin expression through association with other proteins, most notably SET8, which binds to the promoter region of CDH1 and promotes the transcription of N-cadherin through activation of CDH2, the gene which codes for N-cadherin (Lamouille, Xu & Derynck, 2014; Yang et al., 2011).
Targeting EMT-Mediated Metastasis
Four strategies have been proposed to target EMT-mediated metastasis (Fig 2). Current research has predominantly focused on targeting EMT-induction through the inhibition of EMT-initiating signals, such as TGFß and EGF, by targeting their respective receptors (Buonato & Lazzara, 2013; Halder, Beauchamp & Datta, 2005; Wendt & Schiemann, 2009). In a clinical setting, individual targeting of pathways which initiate EMT and MET is implausible due to the significant toxicity of such a treatment. Yet, there is currently no effective method to eliminate EMT-derived mesenchymal cells. They are resistant to both chemotherapy and radiation treatments, which allows them to drive metastasis and cause tumor reoccurrence even after standard treatment has been administered (Bosco, Kenworthy, Zorio & Sang, 2015; Creighton et al., 2009; Gupta et al., 2009; Thomson, 2005).

Figure 2. Potential therapeutic strategies for targeting EMT-induced metastasis. These strategies consist of: (A) Inhibiting EMT-inducing signals from the tumor microenvironment, such as growth factors. (B) Blocking signal transduction pathways, such as MAPK, that relay EMT-initiating signals to the nucleus. (C) Targeting cells while in the mesenchymal state to prevent cell dissemination. (D) Blocking MET to prevent colonization at a distant tumor site (created by student researcher; adapted from Davis, Stewart, Thompson, & Monteith, 2014).
Objective: Targeting Mesenchymal Survival Pathways
Because of the important role EMT-derived mesenchymal cells play in driving the metastatic process and their resistance to standard treatment, the overarching goal was to develop an effective strategy to eliminate EMT-derived mesenchymal cells. A novel approach was taken by identifying survival pathways within the mesenchymal state and testing the effects of several small molecule inhibitors on cell viability of differential epithelial and mesenchymal populations in vitro.
Small molecule inhibitors were selected based on their potency towards their intended target. Inhibitors that demonstrated a lower IC50 (half maximal inhibitory concentration), which indicates the amount of drug necessary to inhibit the intended biological component by half, were considered more potent and were chosen for use in this study. These inhibitors include GDC-0994, MK-2206, AZD1480, BAY 87-2243. GDC-0994 and AZD1480 inhibit the Extracellular Signal–Regulated Kinase (ERK1/2) and the Janus-Kinase 1/2 (JAK1/2), respectively, in an ATP-competitive manner (Ioannidis et al., 2011; Robarge et al., 2014). MK-2206 acts as an allosteric inhibitor of Protein Kinase B (AKT). It is equally potent against both AKT1 and AKT2 but approximately five-fold less potent against AKT3 (Hirai et al., 2010). Meanwhile, BAY 87-224 targets Hypoxia Inducible Factor 1 alpha (HIF1A) through inhibition of mitochondrial complex I (Ellinghaus et al., 2013).
MATERIALS AND METHODS
Bioinformatics
Cytoscape computes survival pathways of the mesenchymal context by visualizing, modeling, and analyzing genetic interaction networks (Cline et al., 2007). Using information from the CytoKegg plugin in Cytoscape and the Kegg Pathway Database, survival pathways were mapped in Cell Designer. These pathways were color-coded based on RNA sequence data previously generated by Dr. John Haley of the Stony Brook Proteomics Center. Nodes which were up-regulated in a two-fold manner, at minimum, were selected as targets for drug inhibition.
Cell Culture
A549, HCC4006, and HCC827 adenocarcinoma cell lines were purchased from the ATCC; two plates of cells were generated per cell line (+/- TGFß). 5ng/ml TGFß was added to each TGFß+ plate in order to induce EMT. In preparation for future assays, a target concentration of 5x10³ cells/100µl was achieved for each plate. Cells were maintained in RPMI Medium 1640 (1x) in a 37°C/5% CO2 environment; Glutamine, Pyruvate, Penicillin Streptomycin (Pen Strep), HEPES, and Fetal Bovine Serum (FBS) were added to the RPMI media. Cell counting was performed every two days using a Hausser Scientific hemocytometer.
Verification of EMT with Light Microscopy
After a ten-day period, images of all cell lines (+/- TGFß) were taken at 60x using a Nikon Eclipse TS100 light microscope.
Verification of EMT with Immunofluorescence
A549 cells (+/- TGFß) were plated on Lab-Tek® II Chamber Slides. Preparation of slides for immunofluorescence was performed following the protocol included in the Life Technologies Image-iT® Fixation/Permeabilization Kit. Mouse Anti E-cadherin (Santa Cruz Biotechnology Catalog #21791) and Mouse Anti-Vimentin (BD Biosciences Catalog #550513) were used as primary antibodies. Alexa Fluor 488 goat anti-mouse (Molecular Probes by Life Technologies Ref. A11001), Alexa Fluor 555 goat anti-mouse (Molecular Probes by Life Technologies Ref. A21422), and Vimentin (D21H3) XP® Rabbit mAb (Alexa Fluor® 555 Conjugate; Cell Signaling Technology #9855) were used as secondary antibodies. All cells were stained with DAPI (Molecular Probes by Life Technologies Ref. D3571). After antibody incubation, ProLong Diamond Anti-fade Mountant (Molecular Probes by Life Technologies Ref. P36965) was applied to prolong fluorescence signal after initial exposure to light. Fluorescence images were captured at 200x and 630x with a Zeiss Fluorescence Microscope and quantified with Image J (Schneider, Rasband, & Eliceiri, 2012).
Verification of EMT with Western Blot
Cell lysates were created from all cell lines (+/- TGFß) using ThermoScientific Pierce RIPA Buffer with protease inhibitors. 3x10⁶ cells were lysed at the conclusion of the ten-day period in which EMT occurred. To prepare loading samples, 25µl of NuPAGE® LDS Sample Buffer (4x) was added to each lysate. ThermoScientific NuPAGE® Bis-Tris Precast Gels were used. Along with the loading samples, 25µl of Invitrogen Novel Sharp Pre-stained Protein Standards was loaded into one well, acting as a protein ladder. After gel electrophoresis, samples were transferred to nitrocellulose membrane using a LKB Electrophoretic Transfer Kit and NuPAGE® Transfer Buffer (2x). The membrane was blocked with 5% milk with TBST. Mouse Anti E-cadherin (Santa Cruz Biotechnology Catalog #21791) and Mouse Anti-Vimentin (BD Biosciences Catalog #550513) were used as primary antibodies. Mouse Anti E-cadherin was diluted 1:500, while Mouse Anti-Vimentin was diluted 1:100. Peroxidase Conjugated Goat Anti-Mouse (ThermoScientific Catalog #32430) was used as the secondary antibody; it was diluted 1:100. After multiple washes with TBST, Enhanced Chemiluminescence (ECL) was performed, with Super Signal Pico (ThermoScientific) acting as the ECL (Mruk & Cheng, 2011). Quantification was performed with Image J.
Preparation of Drugs
Small molecule inhibitors (GDC-0994, MK-2206 2HCl, AZD1480, BAY 87-2243, Bl2536) were purchased from Selleck Chemicals (Houston, TX). Experimental target concentrations for GDC-0994 (ERK1/2 inhibitor), MK-2206 2HCl (Pan-AKT inhibitor), AZD1480 (JAK1/2 Inhibitor), and BAY 87-224 (HIF1A Inhibitor) were 50nM, 0.5µM, and 5µM. The target concentration for Bl2536 (PLK inhibitor) was 1µM.
MTT
All cell lines (+/- TGFß) were plated in Costar White 96 Well Plates; 5x10³ cells were plated in each well. Experimental groups were set up on each plate; all cell types were treated with the three distinct target concentrations of the experimental drugs. After addition of drugs, plates were left in a humidified incubator at 37°C and 5% CO2 for a 48-hour period. MTT assays were then performed to quantify cell death. Absorbance was measured using a Molecular Devices SpectraMax M2. Absorbance was measured in Optical Density (O.D.) units.
Statistics
In each cell line, every experimental condition was performed in triplicate. A549 and HCC827 trials were performed twice. For each data set, average deviation was represented by positive y-error bars, which were graphed using Graph Pad Prism 6. Statistical Analysis was performed using a Student’s T-Test in Microsoft Excel. Significance was set at p<0.05.
RESULTS
Identification of Survival Pathways and Drug Targets
Using Cytoscape and Cell Designer, survival pathways within the mesenchymal state were identified and illustrated (Fig 3). These pathways were focused on due to the presence of multiple proteins which were specifically up-regulated during the transition from epithelial to mesenchymal state. Based on this map, targets for drug inhibition were selected. Because of their specific up-regulation, JAK1/2, AKT1/2/3, and ERK1/2 were chosen as targets. Additionally, HIF1A was selected due to its role in downstream Vascular Endothelial Growth Factor (VEGF) signaling, an important transcriptional regulator of angiogenesis (Karar & Maity, 2011).

Figure 3. Survival pathways in the mesenchymal state. Pathway identification was completed using a bioinformatics analysis of RNA sequence data. Complete pathway mapping was completed using information from the Kegg Pathway databases. Up-regulated proteins in the mesenchymal state are color-coded red. Down-regulated proteins in the mesenchymal state are color-coded green. Proteins which maintained stable expression are color-coded yellow. Cellular effects of the illustrated pathways are color-coded purple. Included in the map are the JAK-STAT pathway, on the top, the PI3K-AKT pathway, in the middle, and the MAPK pathway, on the bottom.
Light Microscopy Analysis
The first test used to verify TGFß induces EMT was a qualitative analysis of cell characteristics using light microscopy. TGFß- cells remain colonized and display a significant proliferative capacity (Fig 4A, 4B, 4C). These characteristics are in line with characteristics expected of epithelial cells. Thus, based on the light microscopy analysis, we concluded that TGFß- cells remained in the epithelial state. Meanwhile, TGFß+ cells were no longer colonized and displayed an individualized, spindle-like morphology (Fig 4D, 4E, 4F). These characteristics are distinctive of cells in the mesenchymal state.

Figure 4. Nikon TS100 light microscopy of in vitro cell models. (A) TGFß- A549 cells (B) TGFß- HCC827 cells (C) TGFß- HCC4006 cells (D) TGFß+ A549 cells (E) TGFß+ HCC827 cells (F) TGFß+ HCC4006 cells. Based on a qualitative analysis of cell characteristics, it was determined that TGFß- cells in groups A, B, and C did not undergo EMT and remained in the epithelial state. Meanwhile, it was determined that TGFß+ cells in groups D, E, and F underwent EMT and are mesenchymal in nature.
Analysis of Protein Expression with Immunofluorescence
In order to validate the results of the light microscopy, protein expression of TGFß- and TGFß+ cells were analyzed using immunofluorescence. TGFß- cells expressed over five times as much E-cadherin than Vimentin when quantified using fluorescent microscopy at both 200x and 630x magnification (Fig 5A, 5B, 5C). On the other hand, TGFß+ cells expressed over six times as much Vimentin as E-cadherin when quantified using fluorescent microscopy at both 200x and 630x magnification (Fig 6A, 6B, 6C).
Because the TGFß- cells demonstrate a high E-cadherin expression and low Vimentin expression, we concluded that the cells were in the epithelial state. Conversely, the TGFß+ cells demonstrate a high Vimentin expression with low E-cadherin expression and were thus in the mesenchymal state.
Analysis of Protein Expression with Western Blot
Finally, EMT was verified by Western blot. Unlike the immunofluorescence analysis in which the expression of two distinct protein markers was assessed, only expression of E-cadherin was examined in this test. Because cancer cells experience reduced E-cadherin expression as they undergo EMT and transition from an epithelial to mesenchymal state, this analysis tested for a decrease in E-cadherin expression between the TGFß- and TGFß+ cells of the same cell line. Because lanes 1 and 3 demonstrate a more expression of E-cadherin than lanes 2 and 4 (35% vs. 20% and 17% vs. 5%, respectively), we concluded that EMT occurred (Fig 7). Thus, the TGFß- cells expressing a higher level of E-cadherin were in the epithelial state, while the TGFß+ cells expressing a lower level of E-cadherin were in the mesenchymal state.
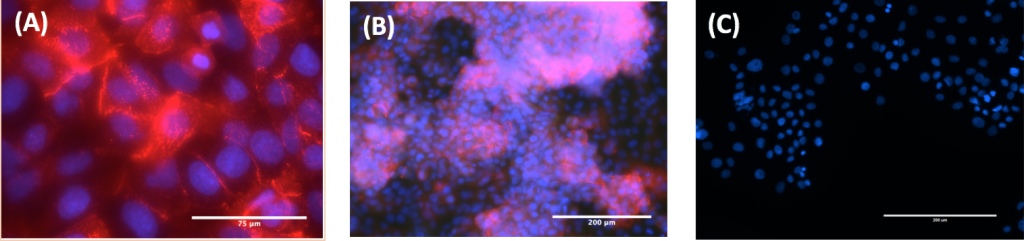
Figure 5. Zeiss Immunofluorescent staining of TGFß- cells. (A) TGFß- A549 cells at 630x (B) TGFß- A549 cells at 200x (C) TGFß+ A549 cells at 200x. All cells were stained with E-cadherin antibody (red) and DAPI (blue). The expression of E-cadherin in images A and B demonstrate TGFß- cells are in the epithelial state. The lack of Vimentin expression in image C demonstrate TGFß+ cells are in the mesenchymal state.

Figure 6. Zeiss Immunofluorescent staining of TGFß+ cells. (A) TGFß+ A549 cells at 630x (B) TGFß+ A549 cells at 200x (C) TGFß- A549 cells at 200x. All cells were stained with Vimentin antibody (red) and DAPI (blue). The expression of Vimentin in images A and B demonstrate that the TGFß+ cells are in the mesenchymal state. The lack of E-cadherin expression in image C demonstrate that the TGFß- cells are in the epithelial state.

Figure 7. Western Blotting of TGFß+ and TGFß- cells. Anti E-cadherin was used to determine the expression levels of E-cadherin. The TGFß- cells express a greater level of E-cadherin than the TGFß+ cells, demonstrating that the TGFß- cells are in the epithelial state, while the TGFß+ cells are in the mesenchymal state.
Cell Viability Assays
Cell viability assays were performed on three lung adenocarcinoma cell lines after treatment: A549, HCC827, and HCC4006. In each cell line, the effect of BAY 87-2243 (HIF1A inhibitor), MK-2206 (AKT inhibitor), AZD1480 (JAK1/2 inhibitor), and GDC-0944 (ERK1/2 inhibitor) at 50nM, 0.5µM, and 5µM, respectively, on cell viability were tested on differential epithelial (TGFß-) and mesenchymal (TGFß+) populations. DMSO and BI2536, a PLK inhibitor that is a known suppressor of tumor growth, served as control groups (Steegmaier et al., 2007). Drug effectiveness was determined by comparing cell viability in mesenchymal populations treated with the drug and cell viability in the DMSO control. The drug which demonstrated a consistent decrease in viability of the drug-treated mesenchymal population compared to the DMSO control was considered the most effective drug in eliminating EMT-derived mesenchymal cells.
In the A549 assay, AZD1480 effectively decreased cell viability among the mesenchymal populations, with greatest effect achieved at 5µM (Fig 8C). Other inhibitors had limited effectiveness in decreasing cell viability (Fig 8A, 8B, 8D). Although the results weren’t significant for most of the HCC827 and HCC4006 assays, a similar trend was observed, with AZD1480 continuing to serve as the most effective inhibitor (Fig 9C, 10C).

Figure 8. A549 Assay. (A) Inhibition activity of BAY 87-2243 (HIF1A) (B) Inhibition Activity of MK-2206 (AKT 1/2/3) (C) Inhibition activity of AZD1480 (Jak 1/2) (D) Inhibition activity of GDC-0994 (Erk 1/2). Each experiment was performed in triplicate (5x10³ cells per well) over a 48-hour inhibition period. After 48 hours, cell death was quantified using MTT; absorbance was read at 590nm. Because the greatest percent decrease occurred between the DMSO mesenchymal population and the 5µM mesenchymal population, AZD1480 (Jak 1/2) was most effective in this trial. *: p<0.05, **: p<0.01

Figure 9. HCC4006 Assay. (A) Inhibition activity of BAY 87-2243 (HIF1A) (B) Inhibition Activity of MK-2206 (AKT 1/2/3) (C) Inhibition activity of AZD1480 (Jak 1/2) (D) Inhibition activity of GDC-0994 (Erk 1/2). Each experiment was performed in triplicate (5x10³ cells per well) over a 48-hour inhibition period. After 48 hours, cell death was quantified using MTT; absorbance was read at 590nm. Because it shows the greatest percent decrease between the DMSO mesenchymal population and the 5µM mesenchymal population, AZD1480 (Jak 1/2) was most effective in this trial. *: p<0.05

Figure 10. HCC827 Assay. (A) Inhibition activity of BAY 87-2243 (HIF1A) (B) Inhibition Activity of MK-2206 (AKT 1/2/3) (C) Inhibition activity of AZD1480 (Jak 1/2) (D) Inhibition activity of GDC-0994 (Erk 1/2). Each data set was performed in triplicate (5x10³ cells per well) over a 48-hour inhibition period. After 48 hours, cell death was quantified using MTT; absorbance was read at 590nm. Because it shows the greatest percent decrease between the DMSO mesenchymal population and the 5µM mesenchymal population, AZD1480 (Jak 1/2) was most effective in this trial. *: p<0.05
DISCUSSION
To date, a very limited amount of research has been conducted that focuses on direct elimination of EMT-derived mesenchymal cells. This study used the novel approach of targeting specific survival pathways within the mesenchymal state as a strategy to eliminate EMT-derived mesenchymal cells. Results demonstrate that AZD1480, a potent ATP-competitive inhibitor of JAK1/2, induced the greatest decrease in cell viability within mesenchymal populations among inhibitors tested. This suggests JAK1/2 is a key modulator of the mesenchymal state and a plausible target of inhibition within EMT-derived mesenchymal cells. JAK1/2 plays an important role in regulating the activation of EMT-initiating transcription factors.
Because of the regulation by JAK1/2, the cell is maintained in a distinctly mesenchymal state as long as JAK1/2 is constitutively expressed, making JAK1/2 a promising drug target. Targeting the JAK-STAT pathway is feasible because of its relative simplicity compared to other pathways (Harrison, 2012). Additionally, JAK1/2 is a preferable target for inhibition because the phosphorylation of STAT3 is one of its primary functions, thus making it less likely that its inhibition will have significant effects on non-malignant cells (Levy & Lee, 2012).
As an ATP-competitive inhibitor, AZD1480 inhibits the ATP-binding pocket of the kinase domain, thus preventing the phosphorylation of STAT3 by JAK1/2 (Hedvat et al., 2009). Consequently, STAT3’s constitutive activation of EMT-transcription factors is prevented. This is the hypothesized mechanism by which AZD1480 eliminates EMT-derived mesenchymal cells (Fig 11).
In the future, continued study of AZD1480’s effectiveness as an anti-metastatic drug is warranted. This includes testing AZD1480’s effect on JAK protein expression at 48, 72, and 96 hours post treatment to ensure there is no protein rebound at a particular time point. Further studies include testing the effectiveness of AZD1480 in eliminating mesenchymal cells derived from other epithelial cell lines (e.g., breast, renal, colon) in vitro in order to potentially broaden the applications. Additionally, studies can be conducted in immune-deficient mice to test the in vivo efficacy of AZD1480.
Besides metastasis, EMT-derived mesenchymal cells have been implicated in numerous other malignancies. For example, because these cells are innately resistant to traditional therapeutics, they remain after the initial rounds of therapy and cause cancer reoccurrence in the future (Guffanti F, 2014). Furthermore, mesenchymal cells have been shown to not only be resistant to therapy themselves, but also to induce chemo-resistance within the surrounding cells. Thus, this strategy acts not only as an anti-metastatic treatment method, but also as a preventative measure for cancer reoccurrence and as a method to combat chemo-resistance. With this advancement, it may become possible for a patient to adhere to a low toxicity, yet effective treatment method. Such a combination has eluded science thus far.

Figure 11. Hypothesized Mechanism of AZD1480 Action in Eliminating EMT-Derived Mesenchymal Cells. By preventing the phosphorylation of STAT3, AZD1480 blocks the activation of EMT-initiating transcription factors which are necessary for cell survival.
ACKNOWLEDGEMENTS
The author would like to thank Dr. John Haley and Dr. Serena McCalla for their guidance and support in making this research possible.
REFERENCES
Association, A. L. (2016). Lung Cancer Fact Sheet. Retrieved March 1, 2016, from http://www.lung.org/lung-disease/lung-cancer/resources/facts-figures/lung-cancer-fact-sheet.html
Bosco, D. B., Kenworthy, R., Zorio, D. A. R., & Sang, Q.-X. A. (2015). Human Mesenchymal Stem Cells Are Resistant to Paclitaxel by Adopting a Non-Proliferative Fibroblastic State. PLOS ONE, 10(6), e0128511. http://doi.org/10.1371/journal.pone.0128511
Brabletz, T. (2012). EMT and MET in Metastasis: Where Are the Cancer Stem Cells? Cancer Cell, 22(6), 699–701. http://doi.org/10.1016/j.ccr.2012.11.009
Buonato, J. M., & Lazzara, M. J. (2014). ERK1/2 Blockade Prevents Epithelial-Mesenchymal Transition in Lung Cancer Cells and Promotes Their Sensitivity to EGFR Inhibition. Cancer Research, 74(1), 309–319. http://doi.org/10.1158/0008-5472.CAN-12-4721
Cao, H., Xu, E., Liu, H., Wan, L., & Lai, M. (2015). Epithelial-mesenchymal transition in colorectal cancer metastasis: A system review. Pathology Research and Practice, 211(8), 557–569. http://doi.org/10.1016/j.prp.2015.05.010
Cheng, G. Z., Zhang, W., Sun, M., Wang, Q., Coppola, D., Mansour, M., … Wang, L.-H. (2008). Twist Is Transcriptionally Induced by Activation of STAT3 and Mediates STAT3 Oncogenic Function. Journal of Biological Chemistry, 283(21), 14665–14673. http://doi.org/10.1074/jbc.M707429200
Cline, M. S., Smoot, M., Cerami, E., Kuchinsky, A., Landys, N., Workman, C., … Bader, G. D. (2007). Integration of biological networks and gene expression data using Cytoscape. Nature Protocols, 2(10), 2366–2382. http://doi.org/10.1038/nprot.2007.324
Creighton, C. J., Li, X., Landis, M., Dixon, J. M., Neumeister, V. M., Sjolund, A., … Chang, J. C. (2009). Residual breast cancers after conventional therapy display mesenchymal as well as tumor-initiating features. Proceedings of the National Academy of Sciences, 106(33), 13820–13825. http://doi.org/10.1073/pnas.0905718106
Derenzini, E., Lemoine, M., Buglio, D., Katayama, H., Ji, Y., Davis, R. E., … Younes, A. (2011). The JAK inhibitor AZD1480 regulates proliferation and immunity in Hodgkin lymphoma. Blood Cancer Journal, 1(12), e46. http://doi.org/10.1038/bcj.2011.46
Ellinghaus, P., Heisler, I., Unterschemmann, K., Haerter, M., Beck, H., Greschat, S., … Ziegelbauer, K. (2013). BAY 87-2243, a highly potent and selective inhibitor of hypoxia-induced gene activation has antitumor activities by inhibition of mitochondrial complex I. Cancer Medicine, n/a–n/a. http://doi.org/10.1002/cam4.112
Guffanti F, D. G. (2014). Ovarian Cancer Recurrence: Role of Ovarian Stem Cells and Epithelial-to-Mesenchymal Transition. Journal of Cancer Science & Therapy, 06(08). http://doi.org/10.4172/1948-5956.1000284
Gupta, P. B., Onder, T. T., Jiang, G., Tao, K., Kuperwasser, C., Weinberg, R. A., & Lander, E. S. (2009). Identification of Selective Inhibitors of Cancer Stem Cells by High-Throughput Screening. Cell, 138(4), 645–659. http://doi.org/10.1016/j.cell.2009.06.034
Halder, S. K., Beauchamp, R. D., & Datta, P. K. (2005). A Specific Inhibitor of TGF-β Receptor Kinase, SB-431542, as a Potent Antitumor Agent for Human Cancers. Neoplasia, 7(5), 509–521. http://doi.org/10.1593/neo.04640
Harrison, D. A. (2012). The JAK/STAT Pathway. Cold Spring Harbor Perspectives in Biology, 4(3), a011205–a011205. http://doi.org/10.1101/cshperspect.a011205
Hedvat, M., Huszar, D., Herrmann, A., Gozgit, J. M., Schroeder, A., Sheehy, A., … Zinda, M. (2009). The JAK2 Inhibitor AZD1480 Potently Blocks Stat3 Signaling and Oncogenesis in Solid Tumors. Cancer Cell, 16(6), 487–497. http://doi.org/10.1016/j.ccr.2009.10.015
Hirai, H., Sootome, H., Nakatsuru, Y., Miyama, K., Taguchi, S., Tsujioka, K., … Kotani, H. (2010). MK-2206, an Allosteric Akt Inhibitor, Enhances Antitumor Efficacy by Standard Chemotherapeutic Agents or Molecular Targeted Drugs In vitro and In vivo. Molecular Cancer Therapeutics, 9(7), 1956–1967. http://doi.org/10.1158/1535-7163.MCT-09-1012
Ioannidis, S., Lamb, M. L., Wang, T., Almeida, L., Block, M. H., Davies, A. M., … Zinda, M. (2011). Discovery of 5-Chloro- N 2 -[(1 S )-1-(5-fluoropyrimidin-2-yl)ethyl]- N 4 -(5-methyl-1 H -pyrazol-3-yl)pyrimidine-2,4-diamine (AZD1480) as a Novel Inhibitor of the Jak/Stat Pathway. Journal of Medicinal Chemistry, 54(1), 262–276. http://doi.org/10.1021/jm1011319
Kalluri, R., & Weinberg, R. A. (2009). The basics of epithelial-mesenchymal transition. Journal of Clinical Investigation, 119(6), 1420–1428. http://doi.org/10.1172/JCI39104
Karar, J., & Maity, A. (2011). PI3K/AKT/mTOR Pathway in Angiogenesis. Frontiers in Molecular Neuroscience, 4. http://doi.org/10.3389/fnmol.2011.00051
Lamouille, S., Xu, J., & Derynck, R. (2014). Molecular mechanisms of epithelial–mesenchymal transition. Nature Reviews Molecular Cell Biology, 15(3), 178–196. http://doi.org/10.1038/nrm3758
Levy, D. E., & Lee, C. (2002). What does Stat3 do? Journal of Clinical Investigation, 109(9), 1143–1148. http://doi.org/10.1172/JCI15650
Mruk, D. D., & Cheng, C. Y. (2011). Enhanced chemiluminescence (ECL) for routine immunoblotting. Spermatogenesis, 1(2), 121–122. http://doi.org/10.4161/spmg.1.2.16606
Provost, J. (2007). MTT Proliferation Protocol. Retrieved from http://web.mnstate.edu/provost/mtt proliferation assay protocol.pdf
Rai, H., & Ahmed, J. (2014). N-cadherin: a marker of epithelial to mesenchymal transition in tumor progression. The Internet Journal of Oncology, 10(1), 1–12.
Ray, M. R., & Jablons, D. M. (2009). Hallmarks of metastasis. Lung Cancer Metastasis: Novel Biological Mechanisms and Impact on Clinical Practice, 29–46. http://doi.org/10.1007/978-1-4419-0772-1_2
Robarge, K., Schwarz, J., Blake, J., Burkard, M., Chan, J., Chen, H., … Moffat, J. G. (2014). Abstract DDT02-03: Discovery of GDC-0994, a potent and selective ERK1/2 inhibitor in early clinical development. Cancer Research, 74(19 Supplement), DDT02–03–DDT02–03. http://doi.org/10.1158/1538-7445.AM2014-DDT02-03
Saitoh, M., Endo, K., Furuya, S., Minami, M., Fukasawa, A., Imamura, T., & Miyazawa, K. (2016). STAT3 integrates cooperative Ras and TGF-β signals that induce Snail expression. Oncogene, 35(8), 1049–1057. http://doi.org/10.1038/onc.2015.161
Steegmaier, M., Hoffmann, M., Baum, A., Lénárt, P., Petronczki, M., Krššák, M., … Rettig, W. J. (2007). BI 2536, a Potent and Selective Inhibitor of Polo-like Kinase 1, Inhibits Tumor Growth In Vivo. Current Biology, 17(4), 316–322. http://doi.org/10.1016/j.cub.2006.12.037
Thomson, S. (2005). Epithelial to Mesenchymal Transition Is a Determinant of Sensitivity of Non-Small-Cell Lung Carcinoma Cell Lines and Xenografts to Epidermal Growth Factor Receptor Inhibition. Cancer Research, 65(20), 9455–9462. http://doi.org/10.1158/0008-5472.CAN-05-1058
Thomson, S., Petti, F., Sujka-Kwok, I., Mercado, P., Bean, J., Monaghan, M., … Haley, J. D. (2010). A systems view of epithelial-mesenchymal transition signaling states. Clinical and Experimental Metastasis, 28(2), 137–155. http://doi.org/10.1007/s10585-010-9367-3
Uddin, N., Kim, R.-K., Yoo, K.-C., Kim, Y.-H., Cui, Y.-H., Kim, I.-G., … Lee, S.-J. (2015). Persistent activation of STAT3 by PIM2-driven positive feedback loop for epithelial-mesenchymal transition in breast cancer. Cancer Science, 106(6), 718–725. http://doi.org/10.1111/cas.12668
Wendt, M. K., Balanis, N., Carlin, C. R., & Schiemann, W. P. (2014). STAT3 and epithelial–mesenchymal transitions in carcinomas. JAK-STAT, 3(2), e28975. http://doi.org/10.4161/jkst.28975
Wendt, M. K., & Schiemann, W. P. (2009). Therapeutic targeting of the focal adhesion complex prevents oncogenic TGF-β signaling and metastasis. Breast Cancer Research, 11(5), R68. http://doi.org/10.1186/bcr2360
Yang, F., Sun, L., Li, Q., Han, X., Lei, L., Zhang, H., & Shang, Y. (2012). SET8 promotes epithelial-mesenchymal transition and confers TWIST dual transcriptional activities. The EMBO Journal, 31(1), 110–123. http://doi.org/10.1038/emboj.2011.364