

Author: Jennifer Hill
Institution: Texas A&M University at Galveston
Date: April 2005
Abstract
Through human activities, endocrine disrupting compounds (EDCs) have become ubiquitous in the aquatic environment. Although much research has examined the effects of these chemicals on reproduction, there remains a paucity of information regarding effects on growth. In order to study the effects of EDCs on growth, hepatocytes (liver cells) and pituitary cells were cultured from female tilapia, Oreochromis mossambicus, and exposed to heptachlor, a pesticide, and DDE, a by-product of the pesticide DDT. Cells and media were assayed for liver vitellogenin, IGFBPs, and pituitary GH. Both heptachlor and DDE exhibited a dose-dependent vitellogenic response in hepatocytes, with heptachlor giving the greatest response. DDE showed an increase in the catabolic 30 kDa IGFBPs compared to low concentrations of positive control E2, which could correlate to a decrease in growth in fish. Pituitary cells exposed to heptachlor displayed a suppression in GH release relative to control, providing further evidence for the decrease in growth rates in response to EDCs. This study also raises questions as to whether the GH-IGF axis reacts in a dose-dependent manner in response to EDCs.
Introduction
Endocrine disrupting compounds (EDCs) are broadly defined as the synthetic chemicals and natural plant compounds that have the ability to alter the pathways of normal endocrine functions in animals. These compounds often disrupt the endocrine system by mimicking an animal's own natural steroids and compounds. Some chemicals known to imitate the actions of natural steroids include organochlorine pesticides, polychlorinated biphenyls (PCBs), biphenyls, dioxins, polyaromatic hydrocarbons (PAHs), and alkylphenols (Van den Belt et al., 2003). The majority of these compounds enter the environment via various municipal and industrial effluents which frequently discharge directly into bodies of water where many animals, including fish, can be directly contaminated (Arukwe, 2001). This contamination has been shown to have dramatic effects on animal reproduction and growth with numerous studies centering on the disruption of the reproductive axis in fish (Arsenault et al., 2004; Bonefeld-Jorgensen et al., 2001; Mills et al., 2001; Okoumassoun, et al., 2002; Okoumassoun et al., 2002).
Endocrine disrupting compounds affect the reproductive axis in fish by mimicking estrogens, specifically estradiol (E2) that is released from ovarian thecal cells. Estradiol then circulates in the body and prompts the production of vitellogenin (Vtg) in the liver in a process known as vitellogenesis. Vitellogenesis is the means by which maturing oocytes in the ovary accumulate yolk. In the majority of fish species, this process is seasonal and only occurs once a year in their reproductive cycle. However, in the tilapia (Oreochromis mossambicus), reproduction occurs year-round with most reproduction occurring in warmer summer months. Since EDCs mimic estrogen, Vtg becomes a by-product of EDC exposure and in many species has become the biomarker. Vtg is a female specific protein and has no function in males. However, E2 and EDCs can induce males to produce the protein. In a study on rainbow trout DDT, dieldrin, aldrin, and E2 all promoted male production of Vtg (Okoumassoun et al., 2002). The production of Vtg in males can cause kidney damage, reduced calcium levels, and liver hyperplasia. In one study, male guppies treated with 4-nonylphenol, a pesticide degradation product, experienced a reduced reproductive performance and underwent significant demasculinization (Cardinali et al., 2004). When EDCs induce vitellogenesis in females, the exposure could cause many problems with reproduction including unseasonably early development of the ovaries (Arukwe, 2001). Other studies have shown that xenobiotics reduce the number of spawning females, as well as reduce total female egg production (Van den Belt et al., 2003).
Endocrine disrupting compounds not only have detrimental effects on reproduction, but on growth as well. In all vertebrates, including fish, growth is regulated by the growth hormone-insulin-like growth factor (GH-IGF) axis. In this axis, GH is released from the pituitary and acts both directly and indirectly to stimulate somatic growth. Many GH effects are mediated by IGF-I, which also stimulates growth. GH signals the synthesis of IGF-I by binding to the GH receptor (GHR) on cellular surfaces in many different tissues, most importantly the liver which is the primary site of IGF-I production (Arsenault et al., 2004). IGF-binding proteins (IGFBPs) bind to IGF-I and IGF-II, and are the main regulators of IGF actions. IGFBPs have a greater affinity for IGF-I than the IGF receptors located on cellular surfaces. IGFBPs may stimulate growth by binding IGF-I and transporting it to a cell receptor, or inhibit growth by sequestering IGF-I away from the cell (Kelley et al., 2001). Tilapia hepatocytes produce 25kDa and 30 kDa IGFBPs, which are thought to catabolically inhibit growth.
In a recent study by Riley et al. (in press), tilapia hepatocytes were shown to increase both 25 kDa and 30 kDa IGFBPs in response to E2. Catfish under stress have also been shown to increase levels of their catabolic IGFBPs (Peterson and Small, 2004). Stressed fish have also been shown to have a decrease in plasma GH levels, which most likely contributes to a decrease in growth rates seen during stress (Auperin et al., 1997; Pickering et al., 1991). Endocrine disrupting compounds are now under investigation as another source of environmental stress which can cause a decrease in growth. In a recent study on salmon, E2 and 4-nonylphenol caused a decrease in plasma IGF-I concentrations, which evokes concerns about salmon's growth and survival in the wild (Arsenault et al., 2004). In another study by Van den Belt et al. (2003), continuous exposure of zebrafish to 17α-ethenylestradiol, a synthetic estrogen, caused a dramatic decrease in body length and weight. A similar reduction in growth has been reported by several anthropogenic compounds in several species of fish (Van den Belt et al., 2003). These changes in growth may be due to added stress that causes fish to switch their metabolic energy away from growth.
This study was designed to examine the effects of endocrine disrupting compounds on the GH-IGF axis in female tilapia (Oreochromis mossambicus). The first objective was to examine a potential relationship between EDC-induced Vtg formation and IGFBPs by using heptachlor and DDE. It was proposed that exposure to these EDCs would result in an increased vitellogenic response and an increase in 30 kDa IGFBPs. The second objective was to determine if exposure to EDCs affects GH release from the pituitary; results are presented from experiments testing the hypothesis that exposure to EDCs will cause a decrease in GH released from cells.
Methods & Materials
This study was conducted in the summer when tilapia are known to be more reproductively active. Sexually mature female (100-120g) tilapia (Oreochromis mossambicus) were selected at random in each study from cultured stock. Vitellogenin and IGFBPs were examined using a hepatocyte culture. GH release was examined using a dispersed cell pituitary culture. The experiments were conducted in accordance with the principles and procedures approved by the Institutional Animal Care and Use Committee, University of Hawaii.
Hepatocyte Culture
Hepatocytes were isolated and cultured according to Schmid et al. (2000) with some modifications. Female fish were weighed and given an intraperitoneal injection with 3000 U of heparin (Sigma, St. Louis) in 0.9% NaCl. Fish were returned to a bucket of water for 5 minutes to allow heparin to circulate. The fish were then rapidly decapitated and the body cavity was opened to expose the liver. The liver was then cannulated with a polyethylene catheter (1 mm diameter) through the hepatic sinus. The liver was perfused with 20 ml of buffer solution (CMF; 142 mM NaCl, 5.4 mM KCl, 0.42 mM Na2HPO4, 0.44 mM KH2PO4, 0.43 mM NaHCO3, glutamine, pH 7.4) supplemented with streptomycin (1 mg/10 ml) and penicillin (0.06 mg/ml), at a flow rate of 1 ml/min by gravity feed in order to remove blood. Next, 0.5 mg/ml collagenase (Sigma) was added to the remaining 20 ml of CMF and perifused through the liver in order to digest the organ. Cells were removed and placed in a sterile Petri dish filled with ice-cold CMC (CMF+ 2.4 mM CaCl2). The cells were dispersed with a 5 cc syringe and screened through sterile mesh (70 µm). The screens were washed with cold CMC. Following washing, the cells were spun at 4° C for 5 minutes at 70 g. The supernatant was discarded and cells were re-dispersed with 25 ml of ice cold CMC. The cells were centrifuged at 4° C for 5 minutes at 50 g. The supernatant was again discarded and the cells were washed again with 25 ml of cold CMC. The cells were spun at 4° C for 5 minutes at 30 g. The supernatant was discarded and resuspended in the appropriate volume of Leibovitz L-15 media (Gibco, New York, pH 7.4), supplemented with streptomycin (1 mg/ml) and penicillin (100 U/ml) to obtain 2 x 10⁶ cells/ml. 300 µl of suspended cells were added to each well of 24-well primaria plates (Fisher, Pittsburgh, PA). The plates were incubated at 25° C for 24 hrs with 95% 02 and 5% CO2.
E2, Heptachlor, and DDE Treatments
17α-estradiol, Heptachlor, and DDE were dissolved in 95% ethanol and then added in the appropriate concentrations to Leibovitz L-15 media. Ethanol never exceeded 0.1% in media. Media was removed after 24 hours of incubation and replaced with treatment media. The plates were then incubated for an additional 48 hrs, after which the conditioned media of the cells was pulled off and stored in microcentifuge tubes at -20°C for further analysis of Vtg and IGFBPs.
Vtg ELISA

Figure 1. Effects of heptachlor and DDE on vitellogenin levels in hepatocyte culture. E2, heptachlor, and DDE all display a dose-related vitellogenic response with heptachlor giving the greatest response. Black = Control; Gray =0.1 µM; Light Blue = 1 µM; Blue = 10 µM; Dark Blue =100 µM; *p
Media Vtg levels were measured via an ELISA according to Denslow et al. (1999) using an antibody generated against killifish (Fundulus heteroclitus) Vtg. 50 µl of sample media was plated in duplicate using 96-well plates and incubated overnight at 4°C. The wells were washed 4 times with TBST (10 mM Tris-HCl, 150 mM NaCl, 0.05% Tween, pH 7). 200 µl of blocking solution (TBST, 1% BSA) was added to block all unbound sites in wells and incubated for 2 hrs at room temperature. The wells were washed 4 times with TBST. 50 µl of anti-Vtg antibody (1:1000) was added in blocking buffer and incubated overnight at 4°C. Wells were washed again 4 times with TBST. 50 µl of secondary antibody (Calbiochem, La Jolla, CA) diluted 1:1000 in blocking buffer was added to wells and incubated for 2 hrs at room temperature. Wells were then washed 4 times with TBST. 100 µl of p-nitrophenyl phosphate disodium salt (1 mg/ml) (Calbiochem) in substrate buffer (30 mM Na2CO3, 2 mM MgCl2 ) was added and incubated for 30 minutes at room temperature. The absorption was then quantified at 405 nM with a SpectraCount plate reader (Packard, CN).
Western Ligand Blot (WLB)
Media IGFBPs were quantified by WLB. 100 µl of sample media were stained with 35 μl of 4X loading dye. Samples were run through a 12.5% polyacrylamide gel along with 15 µl of rat serum used as a positive control. Gels were run at approximately 150V for 3 hrs. Gels were transferred onto nitrocellulose membranes using a wet-transfer apparatus at 250-300 mAMPs overnight in a cold room. Membranes were blocked in 2% milk solution (dry milk, TBST) overnight. 125I-labeled IGF-I (200,000 counts/ml) was added to the milk solution and incubated overnight. To remove non-specific binding, membranes were washed for 10 minutes in TBST and dried. Membranes were placed against Kodak Biofilm at -80°C for one week and then developed.
Pituitary Culture

Figure 2. Effects of DDE and E2 on IGFBPs. 100 µM E2 shows a higher concentration of IGFBPs as compared to 0.1 µM E2. All concentrations of DDE exhibit an increased amount of IGFBPs as compared to 0.1 µM E2. Control and Heptachlor treatments are not visible on gels.
Four seawater tilapia were decapitated and their pituitaries were extracted from the base of the brain. Pituitaries were placed in a small amount of isotonic bicarbonate-Ringer solution (330mOsm) and diced into small fragments. The cells were dispersed and incubated in a trypsin solution (Trypsin, PBS+0.02% EDTA) which was incubated for 1hr at 28° C on a gyrating platform at 40 rpm. Fetal bovine serum was added to terminate the trypsin reaction. Cells were centrifuged at 1200 rpm for 5 minutes at room temperature. The supernatant was decanted and cells were resuspended in Ringer solution media supplemented with penicillin (100 IU/ml), streptomycin (0.1mg/ml), and nyastatin (250 IU/ml) to yield 5.0 x 10⁴ cells/well. 100 µl of cell suspension was added to each well in a 96-well primaria plate (Fisher). Cells were pre-incubated for 4 days at 28° C under a humidified atmosphere of 95% 02 and 5% CO2.
E2 and Heptachlor Pituitary Treatments
17 α-estradiol and Heptachlor were dissolved in 95% ethanol and then added in the appropriate concentrations to culture media for cell treatments. Media was removed after 4 days of incubation and replaced with antibiotic-free treated media. Treated cells were then incubated for 16 hrs after which time the media was extracted. Pituitary cells were then homogenized by sonication and stored along with media at -40° C for later analysis of GH by RIA.
Radioimmunoassay (RIA)
Media GH levels and cell content GH levels were measured by homologous radioimmunoassay (RIA) according to Ayson et al. (1993) and Yada et al. (1994).
Statistical Analysis
Statistics for all data were calculated with the computer program Statistica (Statsoft, Tulsa, OK). Differences among means were determined by one-way ANOVA and critical values were found via Fischer's Least Significant Difference test.
Results
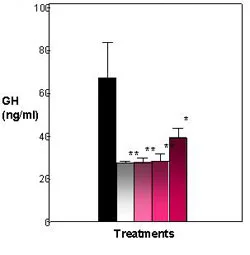
Figure 3. Effects of E2 and heptachlor on GH release in the pituitary. Control fish exhibit a high amount of GH in media. E2 and heptachlor treatments decrease the amount of GH released into the media. Black = control; White = 100 nM E2; Light Pink - 1 nM Heptachlor; Pink = 10 nM Heptachlor; Dark pink = 100 nM Heptachlor; *p
Vtg ELISA
Vtg was found in moderate amounts in the female control. Each treatment of E2, heptachlor, and DDE showed a dose-related vitellogenic response. The positive control E2 gave the greatest response of 580 ng/ml at the 10 μM dose. At the 100 μM E2 dose, the vitellogenic response was suppressed to only 400 ng/ml. Of the EDC treatments, 100 µM heptachlor gave the greatest vitellogenic response at 1000 ng/ml. The lowest doses of 1 and 10 μM only yielded 250 and 380 ng/ml. In the DDE treatment, only 10 µM DDE was significantly (P< .05) different from the control at 390 ng/ml (Figure 1).
WLB
It was difficult to obtain any clear bands in the WLB in order to determine density. The treatments where clear bands were obtained were 0.1 µM E2, 100 µM E2, 1 µM DDE, 10 µM DDE, and 100 µM DDE (Figure 2). The 30 kDa bands that were identified to be catabolic IGFBPs in the 100 µM E2 treatment were significantly darker than those found in the 0.1 µM E2 treatment. All bands found in the DDE treatments were significantly darker than those found in the 0.1 µM E2 treatment. No bands from the control or heptachlor treatments developed clearly enough for analysis.
GH RIA
Significant amounts of GH were found in the media (65 ng/ml) and cells (550 ng/ 50K cells) of the control. Both the E2 treatments and heptachlor showed a significant (P< .001) decrease in GH found in the media (Figure 3). The E2 treatment showed a lesser amount of GH in the media at 28 ng/ml, which was significantly (P < .001) different from the control at 65 ng/ml. The heptachlor treatments also showed a lesser amount of GH in the media. The 1 nM and 10 nM were not significantly different from the positive control at 30 ng/ml and 32 ng/ml. In cell content, the positive control was close to the control treatment at 550 ng/50K cells. The heptachlor treatments showed a significant (P < .001) increase in GH in the cell with an increase in dosage, with only the 100 nM treatment of heptachlor statistically significant from the control at 800 ng/50K cells (Figure 4). By comparing the GH released into the media and the GH content found in the cells, a percent release was calculated. The percent release illustrates that both E2 and heptachlor treatments showed a significant (P < .01) decrease in the release of GH from the cells (Figure 5).
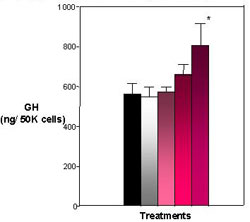
Figure 4. Effects of E2 and Heptachlor on Pituitary GH Content. Both the 10 nM and 100 nM treatment appear to harbor more GH within the pituitary cells with the 100 nM treatment being the most significant. Black = control; White = 100 nM E2; Light Pink - 1 nM Heptachlor; Pink = 10 nM Heptachlor; Dark pink = 100 nM Heptachlor; *p
Discussion
This study shows that EDCs alter components of the GH-IGF axis in female tilapia. Treatments of E2, heptachlor, and DDE all produced a dose-related vitellogenic response in hepatocyte cells with 100 nM heptachlor yielding the greatest response (Figure 1). This is most likely because heptachlor acts as an estrogen agonist, meaning it binds with the estrogen receptor and creates an estrogen-like response. Thus, large doses of heptachlor would cause large doses of Vtg to be produced by the liver cells. These findings compare with that of many other studies which show that high levels of estrogenic organochlorine pesticides are correlated with increased amount of Vtg in fish (Okoumassoun et al., 2002). DDE also produces a vitellogenic response although it is not as pronounced as that seen in heptachlor. It is possible that DDE acts as an androgen agonist, meaning that it binds to androgen receptors but does not stimulate a response. This concurs with a study by Mills et al. (2001) that showed DDE did not significantly alter Vtg content in summer flounder.
After showing that heptachlor and DDE act as EDCs, a WLB blot was performed in order to determine if there was a relationship between vitellogenesis and the amount of catabolic (growth inhibitory) 30kDa IGFBPs. Many of the treatments did not develop from the WLB. This may have occurred due to an insufficient amount of blocking time or because of insufficient binding with the 125I-labeled IGF-I. However from the treatments that were successful, we were still able to identify some differences in the catabolic IGFBPs. When comparing the 0.1 µM E2 and the 100 µM E2, there is a substantial increase in the density of 30kDa IGFBPs in the higher concentration (Figure 2). This agrees with findings by Riley et al. (in press). The increase in the 30 kDa IGFBP, resulting from E2 treatment, may correlate to a decrease in growth. The 30 kDa bands from each concentration of DDE also appear to show a larger amount of IGFBPs as related to the 0.1 µM E2 bands. Therefore, it appears that exposure to DDE may also correlate to an increase in IGFBPs and a decrease in growth.

Figure 5. Effects of E2 and Heptachlor on GH Release. Percent release is determined by comparing the GH released into media to the GH measured in the cell content. E2 and heptachlor suppress the release of GH. Black = control; White = 100 nM E2; Light Pink - 1 nM Heptachlor; Pink = 10 nM Heptachlor; Dark pink = 100 nM Heptachlor; *p
In a study by Peterson and Small (2004), fasted catfish showed an inhibition of growth rates as well as a concurrent increase in 20 kDa IGFBPs, which is shown to be the catabolic IGFBP in catfish. The fish also experienced an increase in cortisol levels, indicating a high stress situation. Experimentally induced stress in fish via handling has also been shown to increase catabolic IGFBPs and cortisol levels (Kelley et al., 2001). Thus, EDCs most likely act as another stress upon the GH-IGF axis which ultimately causes a metabolic shift in energy away from growth. This study also showed that there do not appear to be any differences in the IGFBP bands between different concentrations of DDE. There are several possibilities that may explain this result. First, that the doses were too high to indicate a dose-dependent increase in IGFBPs and thus current concentration values occur above the point of saturation. Second, that IGFBPs may not be dose-dependent; instead, the presence of DDE in the system may induce a stress reaction which causes energy to be shifted away from growth. If the latter is true, vitellogenic responses may not be a sufficient marker to assess problems in growth as related to endocrine disrupters. Currently, in many fish species, high Vtg content is used as a biomarker for exposure to EDCs. However, if growth effects are not dose-dependent, fish could experience a decrease in growth rates without the presence of high levels of Vtg. Further research using smaller doses of EDCs are needed to clarify a relationship between a vitellogenic response and IGFBPs. It is possible that EDCs may cause the same increase in IGFPBs that has been seen in other studies in which fish are starved, or stressed. Thus, in times of stress (here mimicked by exposure to EDCs), there is a metabolic shift in energy away from growth.
Results from the pituitary RIA show that GH release from the cells was significantly decreased in both the E2 treatment, as well as all concentrations of the heptachlor treatment, as compared to the control (Figure 3). In cell content, 100 nM heptachlor showed a significant increase in GH levels while other treatments were not statistically significant from control (Figure 4). However, when looking at percent release it is clear that the presence of E2 and heptachlor causes a suppression in the release of GH from the cells (Figure 5). The suppression of GH by heptachlor is most likely caused by stress induced by the compound on the GH-IGF axis. Confinement stress has caused a suppression in plasma GH levels in tilapia (Oreochromis niloticus) which suggests an association with stress-induced growth suppression in tilapia (Auperin et al., 1997). A similar study by Pickering et al. (1991) also showed a decrease in GH plasma levels in rainbow trout (Oncorhynchys mykiss) in response to both acute and chronic stress; i.e., in response to 4-nonylphenol, Atlantic salmon showed a decrease in plasma levels of IGF-1 and negative effects on salmon weights. The suppression of GH release and IGF-1 in response to endocrine disrupters could be an effect of the stress caused by the compounds. The suppression of IGF-1 as well as a suppression of GH release in fish could account for the decrease in growth rates seen in fish that are exposed to endocrine disrupters. Also, much like the effects of DDE on IGFBPs, there are almost no differences in the suppression of GH release between the different concentrations of heptachlor. This suggests that 1) current doses are above the saturation curve and are too high to determine if GH suppression exhibits a dose-dependent response or 2) GH does not display a dose-dependent response and the presence of EDCs alone may represent some stress to the fish which causes the suppression of GH release. More studies must be done with smaller doses of EDCs in order to determine which is true.
Conclusions
In this study, IGFBPs appear to respond to the presence of EDCs in a similar manner to a stress response. This suggests that EDCs are acting as a stress on the GH-IGF axis which could lead to a decrease in growth. The suppression of GH release from the pituitary in response to heptachlor can be linked to the decrease in growth rates seen in fish exposed to endocrine disrupters. This data compares with data from other studies that show fish under stress have lower amounts of plasma GH. However, in vivo work should be done to show the same decrease in plasma GH in response to EDCs. This study has also raised additional questions as to whether or not the growth axis displays a dose-dependent response to EDCs. Neither the DDE treatments in the IGFBPs study, nor the heptachlor treatments in the GH study acted in a dose-dependent manner. Thus, more research must be done using EDCs of smaller concentrations in order to determine if EDCs act dose-dependently on the GH-IGF axis.
Acknowledgements
The author gratefully acknowledges support from NSF grant #02-43600 and the University of Hawaii Sea Grant College Program. The author would also like to thank Lori Berg, Larry Riley, Tetsuya Hirano, E. Gordon Grau, and other members of the Grau lab for their constant assistance, advice, and guidance.
References
Arukwe A. (2001). Cellular and molecular responses to endocrine-modulators and the impact on fish reproduction. Marine Pollution Bulletin. 42:643-55.
Arsenault JTM, et al. (2004). Effects of water-borne nonylphenol and exposures during parr-smolt transformation on growth and plasma IGF-I of Altlantic salmon (Salmo salar L.) Aquatic Toxicology. 66:255-65.
Auperin B, et al. (1997). Effect of confinement stress on circulating levels of growth hormone and two prolactins in freshwater-adapted tilapia (Oreochromis niloticus). General and Comparative Endocrinology. 108:35-44.
Ayson FG, et al. (1993). Effects of acclimation to hypertonic environment on plasma and pituitary levels of two prolactins and growth hormone in two species of tilapia Oreochromis mossambicus and Oreochromis niloticus. General Comparative Endocrinology. 89:138-48.
Bonefeld-Jorgensen EC, et al. (2001). Effect of highly bioaccumulated polychlorinated biphenyl congeners on estrogen and androgen receptor activity. Toxicology. 158:141-153
Cardinali M, et al. (2004). Temporary impairment of reproduction in freshwater teleost exposed to nonylphenol. Reproductive Toxicology. 18:597-604.
Denslow ND, et al. (1999). Vitellogenin as a biomarker of exposure to estrogen or estrogen mimics. Ecotoxicology. 8:385-98.
Kelley KM, et al. (2001) Serum insulin-like growth factor binding proteins (IGFBPs) as markers for anabolic/catabolic condition in fishes. Comparative Biochemistry and Physiology Part B. 129:229-36.
Mills LJ, et al. (2001). Effects of estrogenic (o,p` DDT; octylphenol) and anti-androgenic (p,p'-DDE) chemicals on indicators of endocrine status in juvenile male summer flounder (Paralichthys dentatus) 52:157-76.
Nicolas JM, (1999) Vitellogenesis in fish and the effects of polycyclic aromatic hydrocarbon contanimants. Aquatic toxicology. 45:77-90.
Okoumassoun L, et al. (2002). Assessing the estrogenic potential of organochlorine pesticides in primary cultures of male rainbow trout (Oncorhynchus mykiss) hepatocytes using vitellogenin as a biomarker. Toxicology. 178:193-207.
Okoumassoun L, et al. (2002). Vitellogenin in tilapia male fishes exposed to organochlorine pesticides in Ouếmế River in Republic of Benin. The Science of the Total Environment. 299:163-72.
Peterson BC and BC Small. (2004). Effects of fasting on circulating IGF-binding proteins, glucose, and cortisol in channel catfish (Ictalurus punctatus). Domestic Animal Endocrinology. 26:231-40.
Pickering AD, et al. (1991). Effects of acute and chronic stress on the levels of circulating growth hormone in rainbow trout, Oncorhynchys mykiss. General and Comparative Endocrinology. 83:86.
Riley LG, et al. (2004). Estradiol-17α and Dihydrotestosterone differentially regulate vitellogenin and insulin-like growth factor-I production in primary hepatocytes of the tilapia, Oreochromis mossambicus. Submitted.
Van den Belt K, et al. (2003). 17α-ethynlestradiol in a partial life-cycle test with zebrafish (Danio rerio): effects on growth, gonads, and female reproductive success. The Science of the Total Environment. 309:127-37.
Yada T, et al. (2000). Changes in plasma levels of the two prolactins and growth hormone during adaptation to different salinities in the euryhaline tilapia, Oreochromis mossambicus. General Comparative Endocrinology. 93:214-23.